Western Cape
State of Air Quality Management Report: 2014
STATE OF AIR QUALITY MANAGEMENT: WESTERN CAPE 2014
ACKNOWLEDGEMENTS
Project Team: D: EA&DP
Dr. Joy Leaner
Mr. Bhawoodien Parker
Mr. Shawn le Roux
Mr. Peter Harmse
Ms. Portia Rululu
Ms. Bianca Hendricks
Mr. Garreth Grosch
Ms. Sally Benson
Mr. Leon Wildschut
Mr. Gerswain Manuel
Ms. Rabiah Reynolds
Ms. Juanita Senekal
Ms. Claudia Frazenburg
Mr. Deon Stoltz
Mr. Njabulo Masuku
Project Team: Municipalities
Mr. Neville Dreyer (Overberg District Municipality)
Ms. Bulelwa Mtakati (Overberg District Municipality)
Mr. Ian Gildenhuys (City of Cape Town)
Mr. Jimmy Knaggs (Drakenstein Municipality)
Dr. Johann Schoeman (Eden District Municipality)
Mr. Marius Engelbrecht (Cape Winelands District Municipality)
Mr. Piet Fabricius (West Coast District Municipality)
Mr. Leon Crafford (Central Karoo District Municipality)
Mr. Gerrit Van Zyl (Central Karoo District Municipality)
STATE OF AIR QUALITY MANAGEMENT: WESTERN CAPE 2014
3
TABLE OF CONTENTS
1. AMBIENT AIR QUALITY MONITORING ......................................................................................................... 19
1.1. PROVINCIAL AMBIENT AIR QUALITY MONITORING NETWORK ......................................................... 19
1.1.1. St. Helena Bay (West Coast District, Saldanha Bay Municipality) ........................................... 20
1.1.1.1. Carbon Dioxide (CO
2
) ........................................................................................................... 22
1.1.1.2. Hydrogen Sulphide (H
2
S) ....................................................................................................... 22
1.1.1.3. Long term air quality trends for St. Helena Bay ................................................................. 23
1.1.2. Malmesbury (West Coast District, Swartland Municipality)...................................................... 23
1.1.2.1. Carbon Monoxide (CO) ....................................................................................................... 25
1.1.2.2. Ozone (O
3
) .............................................................................................................................. 25
1.1.2.3. Nitrogen Dioxide (NO
2
) ......................................................................................................... 26
1.1.2.4. Sulphur Dioxide (SO
2
) ............................................................................................................. 27
1.1.2.5. Particulate Matter (PM
10
) ...................................................................................................... 27
1.1.2.6. Long term air quality data for Malmesbury ....................................................................... 28
1.1.3. Vissershok (City of Cape Town) .................................................................................................... 31
1.1.3.1. Carbon Monoxide (CO) ....................................................................................................... 32
1.1.3.2. Particulate Matter (PM
10
) ...................................................................................................... 33
1.1.3.3. Long term air quality data for Vissershok ........................................................................... 33
1.1.4. Khayelitsha (City of Cape Town) .................................................................................................. 36
1.1.4.1. Long term air quality trends for Khayelitsha ...................................................................... 37
1.1.5. Stellenbosch (Cape Winelands District Municipality) ............................................................... 39
1.1.5.1. Carbon Monoxide (CO) ....................................................................................................... 40
1.1.5.2. Ozone (O
3
) .............................................................................................................................. 40
1.1.5.3. Nitrogen Dioxide (NO
2
) ......................................................................................................... 41
1.1.5.4. Particulate Matter (PM
10
) ...................................................................................................... 41
1.1.5.5. Long Term Air Quality Trend for Stellenbosch .................................................................... 42
1.1.6. Worcester (Cape Winelands District Municipality) .................................................................... 44
1.1.6.1. Long Term Air Quality Data for Worcester ......................................................................... 45
1.1.7. Oudtshoorn (Eden District, Oudtshoorn Municipality) .............................................................. 47
1.1.7.1. Hydrogen Sulphide (H
2
S) ....................................................................................................... 48
1.1.7.2. Long term air quality trends for Oudtshoorn ..................................................................... 49
1.1.8. George (Eden District, George Municipality)............................................................................. 50
1.1.8.1. Carbon Monoxide (CO) ....................................................................................................... 51
1.1.8.2. Ozone (O
3
) .............................................................................................................................. 52
1.1.8.3. Nitrogen Dioxide (NO
2
) ......................................................................................................... 52
1.1.8.4. Long Term Air Quality Trends for George ........................................................................... 53
1.1.9. Dana Bay (Eden District, Mossel Bay Municipality) ................................................................... 55
1.1.9.1. Hydrogen Sulphide (H
2
S) ................................................................................................................ 57
1.1.10. Hout Bay (City of Cape Town) ...................................................................................................... 57
1.1.10.1. Hydrogen Sulphide (H
2
S) ................................................................................................................ 59
1.1.11. Hermanus (Overberg) .................................................................................................................... 59
1.2. MUNICIPAL AMBIENT AIR QUALITY MONITORING: City of Cape Town (CoCT) .............................. 60
1.2.1. Bothasig ............................................................................................................................................. 63
1.2.2. Foreshore .......................................................................................................................................... 66
1.2.3. Goodwood ....................................................................................................................................... 68
1.2.4. Khayelitsha ....................................................................................................................................... 72
1.2.5. Table View ........................................................................................................................................ 77
1.2.6. Wallacedene ................................................................................................................................... 81
1.2.7. Plattekloof ......................................................................................................................................... 85
1.2.8. Bellville-South .................................................................................................................................... 90
1.2.9. City Hall ............................................................................................................................................. 93
1.2.10. Atlantis ............................................................................................................................................... 96
1.2.11. Summary – City of Cape Town ..................................................................................................... 99
2. AIR QUALITY OFFICERS FORUM AND AIR QUALITY MANAGEMENT PLANNING ..................................... 100
2.1. PROVINCIAL AIR QUALITY OFFICER’S FORUM ................................................................................. 100
2.1.1. Key Discussion Topics at AQOF ................................................................................................... 100
2.1.2. Health Risk Assessment Study ...................................................................................................... 101
2.1.3. Municipal Air Quality Officer’s Forum ........................................................................................ 102
2.2. AIR QUALITY MANAGEMENT PLANNING ......................................................................................... 102
STATE OF AIR QUALITY MANAGEMENT: WESTERN CAPE 2014
4
2.2.1. Provincial Air Quality Management Plan .................................................................................. 102
2.2.2. Implementing the Provincial AQMP ........................................................................................... 103
2.2.2.1. Working Group 1 Air Quality Management and Climate Change ............................ 103
2.2.2.2. Working Group 2 Air Quality Education and Awareness Raising ................................ 103
2.2.2.3. Working Group 3 (Compliance Monitoring and Enforcement) .................................. 103
2.2.3. Summary and Conclusions .......................................................................................................... 104
3. AIR QUALITY COMPLIANCE AND ENFORCEMENT .................................................................................... 105
3.1. ATMOSPHERIC EMISSION LICENSING .............................................................................................. 105
3.1.1. Atmospheric Emission License Renewals .................................................................................. 106
3.2. MONITORING COMPLIANCE AND ENFORCEMENT ......................................................................... 107
3.2.1. AQA Amendments and Enforcement ....................................................................................... 107
3.2.2. Regulatory Measures .................................................................................................................... 107
3.2.3. AEL Compliance Inspections ...................................................................................................... 108
3.2.4. Inter-Governmental Task Teams ................................................................................................. 108
3.2.5. Air Pollution Complaints ............................................................................................................... 109
3.3. EMISSIONS INVENTORIES .................................................................................................................. 110
3.4. SUMMARY .......................................................................................................................................... 111
4. MUNICIPAL STATE OF AIR REPORTS - 2014 ............................................................................................... 111
4.1. CITY OF CAPE TOWN METROPOLITAN MUNICIPALITY (CoCT) ........................................................ 112
4.1.1. Air Quality Management Planning ............................................................................................ 112
4.1.2. Education and Awareness Work Stream .................................................................................. 113
4.1.3. Vehicle Emissions Testing Programme ....................................................................................... 116
4.1.4. Monitoring, Standards and Health Work Stream ..................................................................... 116
4.1.5. Air Quality Management Training .............................................................................................. 116
4.1.6. S21 Listed Activities – Atmospheric Emission Licensing ........................................................... 117
4.1.7. Air Quality-related Complaints ................................................................................................... 121
4.1.8. Co-operative Governance ......................................................................................................... 121
4.1.9. Recommendations and way forward ....................................................................................... 121
4.2. DISTRICT MUNICIPALITIES .................................................................................................................. 122
4.2.1. WEST COAST DISTRICT MUNICIPALITY (WCDM) ...................................................................... 122
4.2.1.1. Air Quality Management Planning ............................................................................................ 122
4.2.1.2. Training ............................................................................................................................................ 124
4.2.1.3. Education and Awareness .......................................................................................................... 124
4.2.1.4. S21 Listed Activities – Atmospheric Emission Licensing ........................................................... 124
4.2.1.5. Air Quality-related Complaints ................................................................................................... 124
4.2.1.6. Co-operative Governance ......................................................................................................... 125
4.2.1.7. Air Quality By-laws or legislation ................................................................................................. 125
4.2.1.8. Air Quality Forum/Industry Working Groups .............................................................................. 126
4.2.1.9. Air Quality Monitoring ................................................................................................................... 126
4.2.1.10. Emissions Inventory – S21 Listed Activities per Local Municipal Area ................................... 128
4.2.1.11. Air Vehicle Emission Testing.......................................................................................................... 128
4.2.1.12. Section 21 Listed Activities – Atmospheric Emission Licensing ............................................... 128
4.2.1.13. Inter-Governmental Task Team ................................................................................................... 129
4.2.1.14. Challenges ..................................................................................................................................... 129
4.2.1.15. Recommendations and way forward ....................................................................................... 129
4.2.2. EDEN DISTRICT MUNICIPALITY (EDM)....................................................................................... 130
4.2.2.1. Air Quality Management Planning ............................................................................................ 130
4.2.2.2. Eden Air Quality Officer’s Forum/Industry Working Group ..................................................... 131
4.2.2.3. Awareness Raising ......................................................................................................................... 132
4.2.2.4. EDM Air Quality By-Laws ............................................................................................................... 132
4.2.2.5. Emission Inventory ......................................................................................................................... 132
4.2.2.6. Energy Sources Used in EDM ....................................................................................................... 135
4.2.2.7. Vehicle Emission Testing ............................................................................................................... 135
4.2.2.8. S21 Listed Activities – Atmospheric Emissions Licensing .......................................................... 137
4.2.2.9. Air Quality-related Complaints ................................................................................................... 140
4.2.2.10. Co-operative Governance ......................................................................................................... 140
4.2.2.11. Air Quality Training......................................................................................................................... 141
4.2.2.12. Eden Air Quality Officers Forum .................................................................................................. 141
4.2.2.13. Air Quality Monitoring / Passive sampling ................................................................................. 141
4.2.2.14. Summary ......................................................................................................................................... 143
4.2.3. CAPE WINELANDS DISTRICT MUNICIPALITY (CWDM) ............................................................. 144
4.2.3.1. Air Quality Management Planning ............................................................................................ 144
4.2.3.2. Education and Awareness-raising.............................................................................................. 144
STATE OF AIR QUALITY MANAGEMENT: WESTERN CAPE 2014
5
4.2.3.3. Air Quality Monitoring ................................................................................................................... 144
4.2.3.4. Air Quality Management Training .............................................................................................. 144
4.2.3.5. Air Quality By-laws or legislation ................................................................................................. 145
4.2.3.6. Air Quality Forum/Industry Working Groups .............................................................................. 145
4.2.3.7. Emissions Inventory ........................................................................................................................ 145
4.2.3.8. Air Quality-related Complaints ................................................................................................... 146
4.2.3.9. Co-operative Governance ......................................................................................................... 147
4.2.4. OVERBERG DISTRICT MUNICIPALITY (ODM) ............................................................................ 147
4.2.4.1. Air Quality Management Planning ............................................................................................ 147
4.2.4.2. Air Quality Officer’s Forum ........................................................................................................... 147
4.2.4.3. S21 Listed Activities – Atmospheric Emission Licensing ........................................................... 148
4.2.4.4. Air Quality Training......................................................................................................................... 149
4.2.4.5. Education and Awareness-raising.............................................................................................. 151
4.2.4.6. Recommendations and way forward ....................................................................................... 151
4.2.4.7. Air Quality-related Complaints ................................................................................................... 151
4.2.5. CENTRAL KAROO DISTRICT MUNICIPALITY (CKDM) ............................................................... 151
4.2.5.1. Air Quality Management Planning ............................................................................................ 152
4.2.5.2. S21 Listed Activities – Atmospheric Emission Licensing ........................................................... 152
4.2.5.3. Education and Awareness-raising.............................................................................................. 152
4.2.5.4. Air Quality Training......................................................................................................................... 152
4.2.5.5. Air Quality Monitoring / Passive sampling ................................................................................. 152
4.2.5.6. Air Quality By-laws or legislation ................................................................................................. 152
4.2.5.7. Air Quality Forum / Industry Working Groups ............................................................................ 152
4.2.5.8. Emissions Inventory ........................................................................................................................ 152
4.2.5.9. Vehicle Emission Testing ............................................................................................................... 152
4.2.5.10. Air Quality Related Complaints .................................................................................................. 153
4.2.5.11. Co-operative Governance ......................................................................................................... 153
4.2.5.12. Recommendations and way forward: ...................................................................................... 153
4.2.6. SUMMARY ................................................................................................................................. 153
STATE OF AIR QUALITY MANAGEMENT: WESTERN CAPE 2014
6
LIST OF FIGURES
Figure 1-1: Location of ambient air quality monitoring stations maintained by D: EA&DP .......................... 19
Figure 1-2: Aerial image of St. Helena Bay Ambient Air Quality Monitoring location ................................. 21
Figure 1-3: Annual Wind Rose for St. Helena Bay (2014) ................................................................................. 21
Figure 1-4: Daily Mean CO
2
at St. Helena Bay ................................................................................................. 22
Figure 1-5: Daily Maximum H
2
S (Hourly Mean) at St. Helena Bay (2014) ...................................................... 22
Figure 1-6: Long term CO
2
trend at St. Helena Bay ......................................................................................... 23
Figure 1-7: Long term H
2
S trend at St. Helena Bay ........................................................................................... 23
Figure 1-8: Aerial image of Malmesbury Ambient Air Quality Monitoring location ..................................... 24
Figure 1-9: Annual Wind Rose for Malmesbury (2014) .................................................................................... 25
Figure 1-10: Daily Maximum CO (8 – hour Mean) at Malmesbury (2014)..................................................... 25
Figure 1-11: Daily Maximum O
3
(8 – hour Mean) at Malmesbury (2014) ...................................................... 26
Figure 1-12: Mean NO
2
concentrations (1 – hour) at Malmesbury (2014) .................................................... 26
Figure 1-13: Mean SO
2
concentrations (1 – hour) at Malmesbury (2014) ..................................................... 27
Figure 1-14: Daily Mean PM
10
concentrations (24 – hour) at Malmesbury (2014) ........................................ 28
Figure 1-15: Long Term CO trend at Malmesbury (April 2010 – Dec 2014) ................................................... 29
Figure 1-16: Long Term O
3
trend at Malmesbury (April 2010 – Dec 2014) ..................................................... 29
Figure 1-17: Long Term NO
2
trend at Malmesbury (April 2010 – Dec 2014) .................................................. 30
Figure 1-18: Long Term SO
2
trend at Malmesbury (April 2010 – Dec 2014) ................................................... 30
Figure 1-19: Long Term PM
10
trend at Malmesbury (April 2010 – Dec 2014) ................................................. 31
Figure 1-20: Aerial image of the Vissershok Ambient Air Quality Monitoring Location ............................... 31
Figure 1-21: Annual Wind Rose for Vissershok (2014) ...................................................................................... 32
Figure 1-22: Daily Maximum CO (8 – hour) at Vissershok (2014) ................................................................... 33
Figure 1-23: Daily Mean PM
10
concentrations (24 – hour) at Visssershok (2014) .......................................... 33
Figure 1-24: Long Term CO trend at Vissershok (Jan 2013 – Dec 2014) ........................................................ 34
Figure 1-25: Long Term O
3
trend at Vissershok (Jan 2013 – Dec 2014) .......................................................... 35
Figure 1-26: Long Term NO
2
trend at Vissershok (Jan 2013 – Dec 2014) ....................................................... 35
Figure 1-27: Long Term PM
10
trend at Vissershok (Jan 2013 – Dec 2014) ...................................................... 36
Figure 1-28: An aerial photo of the monitoring station at Khayelitsha .......................................................... 36
Figure 1-29: Trend of Daily (until Aug 2013) Maximum 8-hr Mean CO .......................................................... 37
Figure 1-30: Trend of Daily (until Aug 2013) Maximum 8-hr Mean O
3
........................................................... 38
Figure 1-31: Trend of Daily (until Aug 2013) Maximum Hourly Mean NO
2
.................................................... 38
Figure 1-32: Trend of Daily (until Aug 2013) Mean SO
2
................................................................................... 39
Figure 1-33: An aerial photo of the monitoring station at Stellenbosch ........................................................ 39
Figure 1-34: Daily Maximum CO (8 – hour Mean) at Stellenbosch (2014) .................................................... 40
Figure 1-35: Daily Maximum O
3
concentration (8 – hour Mean) at Stellenbosch (2014) ............................ 41
Figure 1-36: Daily Maximum NO
2
concentration (1 – hour Mean) at Stellenbosch (2014) ......................... 41
Figure 1-37: Daily Mean PM
10
concentrations (24 – hour) at Stellenbosch (2014) ....................................... 42
Figure 1-38: Long Term CO trend at Stellenbosch (Oct 2011 – Dec 2014) .................................................... 43
Figure 1-39: Long Term O
3
trend at Stellenbosch (Nov 2011 – Dec 2014) ..................................................... 43
Figure 1-40: Long Term NO
2
trend at Stellenbosch (Nov 2011 – Dec 2014) .................................................. 44
Figure 1-41: Long Term PM
10
trend at Stellenbosch (Nov 2011 – Dec 2014) ................................................. 44
Figure 1-42: Aerial image of the Worcester Ambient Air Quality Monitoring location ................................ 45
Figure 1-43: Long Term CO trend at Worcester (July 2011 – Dec 2014) ........................................................ 46
Figure 1-44: Long Term O
3
trend at Worcester (July 2009 – Dec 2014) .......................................................... 46
Figure 1-45: Long Term PM
10
trend at Worcester (July 2009 – Dec 2014) ...................................................... 47
Figure 1-46: Aerial image of the Oudtshoorn Ambient Air Quality Monitoring site ...................................... 47
Figure 1-47: Annual wind rose for Oudtshoorn (1 January 2013 – 31 December 2014) ............................... 48
Figure 1-48: Daily Maximum (30 – minute) for H
2
S at Oudtshoorn (2014) ..................................................... 49
Figure 1-49: Long term H
2
S trend at Oudtshoorn (Oct 2011 – Dec 2014) ....................................................... 49
Figure 1-50: Long Term CO
2
Trend at Oudtshoorn (Oct 2011 – Dec 2013) .................................................... 50
Figure 1-51: Aerial image of the George Ambient Air Quality Monitoring location .................................... 50
Figure 1-52: Annual wind rose for George (2014) ............................................................................................ 51
Figure 1-53: Daily Maximum (8 – hour Mean) for CO at George (2014) ....................................................... 52
Figure 1-54: The O
3
concentrations (8 – hour Mean) at George (2014) ........................................................ 52
STATE OF AIR QUALITY MANAGEMENT: WESTERN CAPE 2014
7
Figure 1-55: Daily Maximum (1 – hour Mean) for NO
2
at George (2014) ...................................................... 53
Figure 1-56: Long Term CO trend at George (Jul 2010 – Dec 2014) .............................................................. 54
Figure 1-57: Long term O
3
trend at George (Jul 2010 – Dec 2014) ................................................................ 54
Figure 1-58: Long Term NO
2
trend at George (Jul 2010 – Dec 2014) ............................................................. 55
Figure 1-59: Long term PM
10
trend at George (Jul 2010 – Dec 2014) ............................................................. 55
Figure 1-60: Aerial image of the Dana Bay Ambient Air Quality Monitoring Location ................................ 56
Figure 1-61: Dana Bay Long Term H
2
S Trend .................................................................................................... 57
Figure 1-62: Aerial image of Hout Bay Ambient Air Quality Monitoring location ......................................... 58
Figure 1-63: Annual Wind Rose for Hout Bay (2014) ........................................................................................ 59
Figure 1-64: Daily Maximum H
2
S (Hourly Mean) at Hout Bay (2014) ............................................................. 59
Figure 1-65: Aerial image of the Hermanus Ambient Air Quality Monitoring Location ............................... 60
Figure 1-66: The City of Cape Town’s Air Quality Monitoring Network ......................................................... 62
Figure 1-67: Bothasig 10 – minute average for SO
2
(1January 2014 – 31 December 2014) ........................ 63
Figure 1-68: Bothasig 1 – hourly average for SO
2
(1January 2014 – 31 December 2014) ........................... 64
Figure 1-69: Bothasig 24 – hour average for SO
2
(1January 2014 – 31 December 2014) ............................ 64
Figure 1-70: Bothasig 1 – hourly average for NO
2
(1January 2014 – 31 December 2014) ........................... 65
Figure 1-71: Bothasig annual average for NO
2
(1January 2014 – 31 December 2014) ............................... 65
Figure 1-72: Bothasig annual wind rose (1January 2014 – 31 December 2014) ........................................... 66
Figure 1-73: Foreshore 24 – hour average for PM
10
(1January 2014 – 31 December 2014)......................... 67
Figure 1-74: Foreshore annual average for PM
10
(1January 2014 – 31 December 2014) ............................ 67
Figure 1-75: Goodwood 10 – minute average for SO
2
(1January 2014 – 31 December 2014) ................... 68
Figure 1-76: Goodwood 1 - hour average for SO
2
(1January 2014 – 31 December 2014) .......................... 69
Figure 1-77: Goodwood 24 - hour average for SO
2
(1January 2014 – 31 December 2014) ........................ 69
Figure 1-78: Goodwood 1 - hourly average for NO
2
(1January 2014 – 31 December 2014) ...................... 70
Figure 1-79: Goodwood annual average for NO
2
(1January 2014 – 31 December 2014) .......................... 70
Figure 1-80: Goodwood 24 - hour average for PM
10
(1January 2014 – 31 December 2014) ...................... 71
Figure 1-81: Goodwood annual average for PM
10
(1January 2014 – 31 December 2014) ......................... 71
Figure 1-82: Goodwood annual wind rose (1January 2014 – 31 December 2014) ...................................... 72
Figure 1-83: Khayelitsha 10 – minute average for SO
2
(1January 2014 – 31 December 2014) ................... 73
Figure 1-84: Khayelitsha 1 - hourly average for SO
2
(1January 2014 – 31 December 2014)....................... 74
Figure 1-85: Khayelitsha 24 - hour average for SO
2
(1January 2014 – 31 December 2014) ....................... 74
Figure 1-86: Khayelitsha 1 - hourly average for NO
2
(1January 2014 – 31 December 2014) ...................... 75
Figure 1-87: Khayelitsha annual average for NO
2
(1January 2014 – 31 December 2014) .......................... 75
Figure 1-88: Khayelitsha 24 - hour average for PM
10
(January 2014 – 31 December 2014) ........................ 76
Figure 1-89: Khayelitsha annual average for PM
10
(January 2014 – 31 December 2014) ........................... 76
Figure 1-90: Tableview 10 – minute average for SO
2
(1January 2014 – 31 December 2014) ...................... 77
Figure 1-91: Tableview 1 - hourly average for SO
2
(1January 2014 – 31 December 2014) ......................... 78
Figure 1-92: Tableview 24 - hour average for SO
2
(1January 2014 – 31 December 2014) .......................... 78
Figure 1-93: Tableview 1 - hourly average for NO
2
(1January 2014 – 31 December 2014) ........................ 79
Figure 1-94: Tableview annual average for NO
2
(1January 2014 – 31 December 2014) ............................ 79
Figure 1-95: Tableview 24 - hour average for PM
10
(1January 2014 – 31 December 2014) ........................ 80
Figure 1-96: Tableview annual average for PM
10
(1January 2014 – 31 December 2014) ............................ 80
Figure 1-97: Tableview annual wind rose (1January 2014 – 31 December 2014) ........................................ 81
Figure 1-98: Wallacedene 10 – minute average for SO
2
(1January 2014 – 31 December 2014) ................ 82
Figure 1-99: Wallacedene 1 – hourly average for SO
2
(1January 2014 – 31 December 2014) ................... 83
Figure 1-100: Wallacedene 24 – hour average for SO
2
(1January 2014 – 31 December 2014) .................. 83
Figure 1-101: Wallacedene 1 – hourly average for NO
2
(1January 2014 – 31 December 2014) ................ 84
Figure 1-102: Wallacedene annual average for NO
2
(1January 2014 – 31 December 2014) .................... 84
Figure 1-103: Wallacedene 24 - hour average for PM
10
(1January 2014 – 31 December 2014) ................ 85
Figure 1-104: Wallacedene annual average for PM
10
(1January 2014 – 31 December 2014) .................... 85
Figure 1-105: Plattekloof 10 - minute average for SO
2
(1January 2014 – 31 December 2014) ................... 86
Figure 1-106: Plattekloof 1 - hourly average for SO
2
(1January 2014 – 31 December 2014) ...................... 87
Figure 1-107: Plattekloof annual average for SO
2
(1January 2014 – 31 December 2014) .......................... 87
Figure 1-108: Plattekloof 1 - hourly average for NO
2
(1January 2014 – 31 December 2014)...................... 88
Figure 1-109: Plattekloof annual average for NO
2
(1January 2014 – 31 December 2014) .......................... 88
Figure 1-110: Plattekloof 24 - hour average for PM
10
(1January 2014 – 31 December 2014) ...................... 89
STATE OF AIR QUALITY MANAGEMENT: WESTERN CAPE 2014
8
Figure 1-111: Plattekloof annual average for PM
10
(1January 2014 – 31 December 2014) ......................... 89
Figure 1-112: Bellville-South 10 - minute average for SO
2
(1January 2014 – 31 December 2014) ............. 90
Figure 1-113: Bellville-South 1 - hourly average for SO
2
(1January 2014 – 31 December 2014) ................. 91
Figure 1-114: Bellville-South 24 - hour average for SO
2
(1January 2014 – 31 December 2014) ................. 91
Figure 1-115: Bellville-South 24 - hour average for PM
10
(1January 2014 – 31 December 2014) ................ 92
Figure 1-116: Bellville-South annual average for PM
10
(1January 2014 – 31 December 2014) ................... 92
Figure 1-117: City Hall 10 - minute average for SO
2
(1January 2014 – 31 December 2014) ....................... 93
Figure 1-118: City Hall 1 – hourly average for SO
2
(1January 2014 – 31 December 2014) .......................... 94
Figure 1-119: City Hall 24 – hour average for SO
2
(1January 2014 – 31 December 2014) ........................... 94
Figure 1-120: City Hall 1 – hourly average for NO
2
(1January 2014 – 31 December 2014) ......................... 95
Figure 1-121: City Hall annual average for NO
2
(1January 2014 – 31 December 2014) .............................. 95
Figure 1-122: Atlantis 10 - minute average for SO
2
(1January 2014 – 31 December 2014) ......................... 96
Figure 1-123: Atlantis 1 - hourly average for SO
2
(1January 2014 – 31 December 2014) ............................ 97
Figure 1-124: Atlantis 24 - hour average for SO
2
(1January 2014 – 31 December 2014) ............................. 97
Figure 1-125: Atlantis 1 - hourly average for NO
2
(1January 2014 – 31 December 2014) ........................... 98
Figure 1-126: Atlantis annual average for NO
2
(1January 2014 – 31 December 2014) ............................... 98
Figure 1-127: Atlantis annual wind rose (1January 2014 – 31 December 2014) ........................................... 99
Figure 3-1: Total Complaints received during 2014 in the Western Cape ................................................... 110
Figure 4-1: CoCT awareness raising to Pre- and Primary school learners .................................................. 114
Figure 4-2: S21 Listed Activities – AEL in the WCDM ....................................................................................... 124
Figure 4-3: The location of Saldanha Bay air quality monitoring stations ................................................... 127
Figure 4-4: Map showing location of the Eden District Municipal region .................................................... 130
Figure 4-5: Members of the EDM Air Quality Management Plan Steering Committee .............................. 131
Figure 4-6: Air quality education and awareness raising in the EDM .......................................................... 132
Figure 4-7: EDM staff members conducting vehicle emission testing in Riversdale .................................. 136
Figure 4-8: The process of emission testing was explained to the driver of a diesel truck ....................... 136
Figure 4-9: EDM passive sampling project at Mossel Bay and Albertinia ................................................... 142
Figure 4-10: Passive sampling results for H
2
S for June 2014 .......................................................................... 142
Figure 4-11: Passive sampling results for SO
2
, NO
2
and BTEX in Riversdale ................................................. 143
Figure 4-12: Members of the ODM Air Quality Management Plan Steering Committee ........................... 148
Figure 4-13: Bulelwa Mtakati (Municipal Health) and Rulien Volschenk (Environmental Management)
from ODM after receiving their EMI certificates .................................................................................... 149
Figure 4-14: Training session on ambient air quality monitoring in Hermanus ........................................... 150
Figure 4-15: Training session on ambient air quality monitoring in Hermanus AQMS ................................ 150
Figure 4-16: Training session on ambient air quality monitoring in Hermanus AQMS ................................ 150
STATE OF AIR QUALITY MANAGEMENT: WESTERN CAPE 2014
9
LIST OF TABLES
Table 1-1: Location of the Western Cape Province Ambient Air Quality Monitoring Stations ..................... 20
Table 1-2: St. Helena Bay Data Capture after quality control (2014)............................................................. 21
Table 1-3: Malmesbury Data Capture after quality control (2014) ................................................................ 24
Table 1-4: Vissershok Data Capture (2014) ...................................................................................................... 32
Table 1-5: Stellenbosch Data Capture after quality control (2014) ............................................................... 39
Table 1-6: Worcester Data Capture after quality control (2014) .................................................................... 45
Table 1-7: Oudtshoorn Data Capture after quality control (2014) ................................................................. 48
Table 1-8: George Data Capture after quality control (2014) ........................................................................ 50
Table 1-9: Dana Bay Data Capture after quality control (2014) .................................................................... 56
Table 1-10: Hout Bay Data Capture after quality control (2014) .................................................................... 58
Table 1-11: Hermanus Data Capture after quality control (2014) .................................................................. 60
Table 1-12: Bothasig SO
2
and
NO
2
Frequency of Exceedances and Data Recovery (2014) ....................... 63
Table 1-13: Foreshore PM10 Frequency of Exceedances and Data Recovery (2014) ................................ 66
Table 1-14: Goodwood SO
2
, NO
2
and PM
10
Frequency of Exceedances and Data Recovery (2014) ....... 68
Table 1-15: Khayelitsha SO
2
, NO
2
and PM
10
Frequency of Exceedances and Data Recovery (2014) ....... 72
Table 1-16: Tableview SO
2
, NO
2
and PM
10
Frequency of Exceedances and Data Recovery (2014) ......... 77
Table 1-17: Wallacedene SO
2
, NO
2
and PM
10
Frequency of Exceedances and Data Recovery (2014) ... 82
Table 1-18: Plattekloof SO
2
, NO
2
and PM
10
Frequency of Exceedances and Data Recovery (2014) ......... 86
Table 1-19: Bellville-South SO
2
and PM
10
Frequency of Exceedances and Data Recovery (2014) ........... 90
Table 1-20: City Hall SO
2
NOx and CO Frequency of Exceedances and Data Recovery (2014) ............... 93
Table 1-21: Atlantis SO
2
and NOx Frequency of Exceedances and Data Recovery (2014) ....................... 96
Table 2-1: List of areas where Epidemiological Studies and HRA Studies are to be undertaken ............. 101
Table 3-1: AEL applications processed in the Western Cape, as at 31 December 2014 ........................... 106
Table 3-2: Inter-Governmental Task Teams ................................................................................................... 108
Table 4-1: Air quality management events schedule 2014 .......................................................................... 115
Table 4-2: Total number of diesel vehicle tested during January 2014 to December 2014 ...................... 116
Table 4-3: S21 Listed Activities and number of Licences issued in the CoCT during 2014 ......................... 118
Table 4-4: Number of air quality-related complaints received in the CoCT during 2014.......................... 121
Table 4-5: Identified matters in the AQMP of the WCDM .............................................................................. 122
Table 4-6: Number of air quality-related complaints received in the WCDM ............................................ 125
Table 4-7: Compliance and enforcement inspections conducted in the WCDM (2014) .......................... 125
Table 4-8: The co-ordinates of Saldanha Bay Municipality air monitoring network .................................. 126
Table 4-9: Monthly Dust Fallout rates in Saldanha Bay Municipality 2014 (mg/m
2
/day) .......................... 127
Table 4-10: Status of S21 Listed Activities in the WCDM during 2014 ........................................................... 128
Table 4-11: List of AEL applications received and processed in the WCDM ............................................... 128
Table 4-12: List of AEL renewal applications received and/or processed during the 2014 reporting period
................................................................................................................................................................... 129
Table 4-13: Air Quality Management Plan objectives for the EDM .............................................................. 130
Table 4-14: Industrial Emission Sources in Bitou ............................................................................................. 133
Table 4-15: Industrial Emission Sources in Knysna ......................................................................................... 133
Table 4-16: Industrial Emission Sources in George ........................................................................................ 133
Table 4-17: Industrial Emission Sources in Mossel Bay .................................................................................. 133
Table 4-18: Industrial Emission Sources in Hessequa..................................................................................... 134
Table 4-19: Industrial Emission Sources in Kannaland ................................................................................... 134
Table 4-20: Industrial Emission Sources in Oudtshoorn ................................................................................. 134
Table 4-21: Number of household per fuel type used ................................................................................... 135
Table 4-22: List of Listed Activities – Atmospheric Emissions Licensing ........................................................ 138
Table 4-23: Number of air quality-related complaints received in the EDM .............................................. 140
Table 4-24: EDM passive sampling for SO
2
, NO
2
, H
2
S and BTEX .................................................................... 141
Table 4-25: Summary of the S21 Listed Activities – Atmospheric Emissions Licensing in the CWDM ........ 145
Table 4-26: Number of air quality-related complaints received in the CWDM .......................................... 146
Table 4-27: Listed Activities – Atmospheric Emissions Licensing in the ODM .............................................. 148
Table 4-28: Number of air quality-related complaints received in the ODM ............................................. 151
STATE OF AIR QUALITY MANAGEMENT: WESTERN CAPE 2014
10
STATE OF AIR QUALITY MANAGEMENT: WESTERN CAPE 2014
11
LIST OF ACRONYMS
ACSA Airports Company South Africa
APPA Atmospheric Pollution Prevention Act, Act No. 45 of 1965
AQM Air Quality Management
AQMP Air Quality Management Plan
AQOF Air Quality Officers Forum
CO Carbon Monoxide
CO
2
Carbon Dioxide
CoCT City Of Cape Town
Collect-ER Collect Emissions Reporting
CSIR Council for Scientific and Industrial Research
CKDM Central Karoo District Municipality
CWDM Cape Winelands District Municipality
D: EA&DP Western Cape: Department of Environmental Affairs and Development Planning
DEA National Department of Environmental Affairs
EDM Eden District Municipality
EEA European Environmental Commission
EI Emissions Inventory
EMI Environmental Management Inspector
ESP External Service Provider
LAT Lower Assessment Threshold
NEMA National Environmental Management Act, Act No. 107 of 1998
NEM: AQA National Environmental Management Air Quality Act, Act 39 of 2004
NO
x
Nitrogen oxides
O
3
Ozone
PM
10
Particulate Matter of aerodynamic diameter less than 10 um
SA-AAQS South African Ambient Air Quality Standard
SANAS South African National Accreditation System
SOP Standard Operating Procedures
SO
2
Sulphur Dioxide
UAT Upper Assessment Threshold
US EPA United States Environmental Protection Agency
VOC Volatile Organic Compound
WCDM West Coast District Municipality
WHO World Health Organisation
STATE OF AIR QUALITY MANAGEMENT: WESTERN CAPE 2014
12
STATE OF AIR QUALITY MANAGEMENT: WESTERN CAPE 2014
13
FOREWORD
The Western Cape Government, through the Department of Environmental Affairs and Development
Planning (D: EA&DP), both implements systems and provides an oversight role in the Province with
respect to air quality management. The Directorate: Air Quality Management (D: AQM) lies within D:
EA&DP, and ensures that air quality management and monitoring is comprehensively addressed in the
Western Cape.
As sustainable economic growth and development is all important in this Province, it is important that
all authorities in the Western Cape realize their roles and responsibilities in terms of the National
Environmental Management: Air Quality Act (Act 39 of 2004; NEM: AQA). The D: AQM has provided
platforms for air quality officers in the Province to meet quarterly and deliberate on matters pertaining
to air quality management such as, training, legislative reform, atmospheric emission licensing and the
implementation of Air Quality Management Plans. With the full implementation of the NEM: AQA, it has
become clear that amendments were required to further improve the management of air quality in the
country. The National Environmental Management: Air Quality Amendment Act (Act No. 20 of 2014)
promulgated on 19 May 2014, has seen Licensing Authorities and industry working closely with each
other to ensure a seamless process for the application of Atmospheric Emission Licences.
From this Annual State of Air Quality Management Report, it is clear that the citizens of the Western
Cape are still enjoying good air quality, where it is being monitored in the Province. This does not mean
that we must become complacent, however. In terms of sustainable economic growth and
development in the Province, it is important for us as authorities to fulfil our obligation to our citizens by
implementing our approved Air Quality Management Plans (AQMP), in alignment with the NEM: AQA.
In this regard, approved AQMPs are effective tools towards ensuring that the Western Cape reaches its
goal of becoming the lowest carbon Province in South Africa and the leading green economic hub of
the African continent, while growing its economy. In 2014, our air quality officers have proven that they
will continue to deliver and serve the people of the Western Cape.
This report was compiled with the assistance and input of the Municipalities and provides a
comprehensive overview of the State of Air Quality Management within the Province and the progress
made towards implementing and enforcing the NEM: AQA.
STATE OF AIR QUALITY MANAGEMENT: WESTERN CAPE 2014
14
STATE OF AIR QUALITY MANAGEMENT: WESTERN CAPE 2014
15
EXECUTIVE SUMMARY
The State of Air Quality Management: Western Cape 2014 report is a comprehensive report on the
management and monitoring of air quality in the Western Cape by the Department of Environmental
Affairs and Development Planning (D: EA&DP) and Municipalities in the Western Cape. The report has
been compiled with the support of the Metropolitan, District and Local Municipalities.
Ambient Air Quality Monitoring
The D: EA&DP commenced with ambient air quality monitoring in 2008, with the installation of a network
of ambient air quality monitoring stations. To date eleven (11) fully equipped monitoring stations are in
operation across the Province, as part of the Western Cape Ambient Air Quality Monitoring Network
(Table i). Two (2) of these monitoring stations were commissioned during the early part of 2014. A total
of 13 monitoring stations are planned for the future.
The City of Cape Town, which has been monitoring ambient air quality since the early sixties, is
independently operating a network comprising eleven (11) monitoring stations (Table ii). Detailed
information and discussion of all the monitoring stations for the year 2014 is presented in this report.
Pollutants of concern in the Western Cape are airborne Particulate Matter (PM
10
), Ozone (O
3
) and
Hydrogen Sulphide (H
2
S). Due to the Western Cape Provinces complex regional meteorology, Ozone
(O
3
) and PM
10
often follow seasonal patterns over the long term; however, H
2
S can be impacted on by
local activities on a daily basis.
Table i. Location of the Western Cape Province Ambient Air Quality Monitoring Stations
Municipality
Location
Month/Year
Commenced
Cape Winelands
Meirings Park Electrical Substation, Worcester
July 2009
West Coast
Swartland High School, Malmesbury
April 2010
Eden
Municipal Swimming Pool, George
July 2010
Eden
Bongolethu Clinic, Oudtshoorn
April 2011
West Coast
HP Williams Primary School, St Helena Bay
April 2011
City of Cape Town
Khayelitsha Training Centre, Khayelitsha
May 2011
City of Cape Town
Morningstar Small Holdings, Vissershok
September 2011
Cape Winelands
Cape Winelands District Municipality Office, Stellenbosch
October 2011
Eden
Dana Bay Reservoir, Dana Bay
November 2011
City of Cape Town
Sentinel Primary School, Hout Bay
March 2014
Overberg
Mount Pleasant Primary School, Hermanus
March 2014
Table ii. Location of the City of Cape Town’s Ambient Air Quality Monitoring Stations
Municipality
Location
Year
Commissioned
City of Cape Town
Bothasig
1995
City of Cape Town
Foreshore
1995
City of Cape Town
Goodwood
1993
City of Cape Town
Khayelitsha
2002
City of Cape Town
Tableview
1994
City of Cape Town
Wallacedene
2006
City of Cape Town
Plattekloof
2013
City of Cape Town
Bellville South
2003

STATE OF AIR QUALITY MANAGEMENT: WESTERN CAPE 2014
16
City of Cape Town
City Hall, Cape Town
1994
City of Cape Town
Atlantis
2008
City of Cape Town
Molteno (Reservoir at Table Mountain) – not reported on
1994
Air Quality Officers Forum and Air Quality Management Planning
The Western Cape Provincial Air Quality Forum is a quarterly event that is aimed at providing a forum for
coordination and to discuss air quality matters related to the progress in the implementation of the
National Environmental Management: Air Quality Act (Act No. 39 of 2004) and its National Framework
and, most importantly, the efficacy of this implementation.
The Western Cape Provincial Air Quality Officers Forum (AQOF) was established in 2006 to give effect to
the National Environmental Management: Air Quality Act (Act No 39 of 2004; NEM: AQA). Later, the
need arose for a Noise Control Forum as many of the authorities were also dealing with noise matters in
their jurisdictional areas. In this regard, the Western Cape Noise Control Forum was included as part of
the AQOF. The forum meetings, which are comprised of a two day event, are rotated at venues across
the five District Municipalities and the Metropolitan Municipality, within the Province.
The first day of the AQOF meeting is devoted to training programs on selected subject matter and is
also used by the AQOs to discuss and exchange views pertaining to air quality management matters,
such as current and new legislation, Atmospheric Emissions Licensing, air quality and noise related
complaints, regulations and Air Quality Management Plans (AQMPs).
Regular report backs are provided by officials of D: EA&DP, the Metropolitan, Districts and Local
Municipalities at the forum, with regards to air quality projects, air quality monitoring, licensing, emissions
inventories, compliance and enforcement etc.
In order to give effect to the implementation of the Western Cape AQMP and that of the various
Municipalities, the second day focuses on the work undertaken by the three Working Groups, as given
below.
Working Group 1, Air Quality Management and Climate Change, deals with issues regarding
emissions inventories, municipal By-laws, minimum standards for energy efficiency, integrated
plans to manage precursors to reduce regional scale ozone and ozone depleting substances.
Working Group 2, Air Quality Education serves to encourage the District, Metropolitan and
Local municipalities to facilitate various awareness raising events during the year. The working
group discusses awareness raising material for distribution within their areas, as well as the
drafting of municipal By-laws.
Working Group 3, Compliance Monitoring and Enforcement focuses its discussions on action
plans to identify and manage illegal listed activities and participation in crime prevention
forums. The establishment of air quality management working groups between industries and
the various licensing authorities are encouraged to facilitate report back from the Listed
Activities on compliance and enforcement on a quarterly basis. In the West Coast, Eden District
and Cape Winelands District Municipalities, these working groups are established and
functioning well.
Workshops with Councillors and Municipal Managers were successfully arranged with a view to
gain support from top management to accept the roles and responsibilities of Municipalities,
with respect to air quality management. The purpose was to ensure that Municipalities
designate Air Quality Officers (AQOs) and secure funding for the municipalities to draft their
AQMPs.
In terms of Atmospheric Emission Licenses (AELs), as per the NEM: AQA, the Metro, EDM and WCDM
have established specialised air quality management sections and are effectively addressing all air
quality management related matters.
Within the Western Cape, the licensing authorities have accepted their roles and responsibilities with
respect to the responsibility of dealing with the new AELs. The Metro, EDM and WCDM have established
specialised air quality management sections and are effectively addressing all air quality management
STATE OF AIR QUALITY MANAGEMENT: WESTERN CAPE 2014
17
related matters. However, in the ODM, CKDM and the CWDM, air quality management remains a
shared function with environmental health functions.
In preparation for industries conducting S21 Listed Activities, in terms of applying for the renewal of their
first AEL, as per NEM: AQA; which came into force on 01 April 2013, the Licensing Authorities made a
concerted effort to bring this to the attention of industry within their areas of jurisdiction. The matter was
extensively planned and discussed at the AQOFs and in this manner the AQOs gained a common
understanding of what was required of them during this process. However, capacity constraints resulted
in some licensing authorities not being able to conclude the issuing of some AEL renewals.
Compliance and Enforcement
Various licensing authorities received applications for postponement of compliance time-frames
regarding the emission standards and the authorities discussed the reasons and the legal provisions for
postponement applications. It was decided to develop a standard operating procedure (SOP) to
consider the applications. “Detailed review” for all applications were scheduled for the month of
October between the NAQO and all affected Provinces and LA’s to collaboratively consider the
applications.
The Department continued with compliance and enforcement inspections carried out at various sites in
the Province. The D: EA&DP carried out “Blitz” enforcement on illegal activities in the Western Cape in
consultation with municipalities during 2014. The Inter-Governmental Task Teams (IGTTs) continued to
address complex air quality matters.
AEL Fees Calculator
Although the AEL renewal process commenced on 01 April 2013, a standardised AEL fee calculator
was discussed by all licensing authorities at the Annual Air Quality Lekgotla. A proposal for a fixed band
system based on number of listed activities was proposed. The new proposed Regulations will be
published soon for public comment and Gazetted, pending finalisation.
Illegal AEL activities
Licensing authorities have reported all illegal activities to the compliance and enforcement authorities
for corrective action. However, past experience has shown that the interpretation of offences by EMI’s
might be problematic for facilities.
Emission Inventories
Emission inventories remain an important tool in air quality management. Efforts were made during 2014
by the D: EA&DP and the various Municipalities to establish and update emission inventories as required
by new regulations. Future efforts are geared to having an all-encompassing emission inventory to
effectively address all stationary, mobile, area and line sources in the Western Cape.
Clarity on the responsibilities of Local and District Municipalities
The divisions of roles and responsibilities between Local and District Municipalities are not clearly
understood by municipalities and the lack of clarity continues to hamper the implementation of air
quality management functions in the Province. This has resulted in some municipalities not having
adequate financial resources, not appointing AQOs, not developing AQMPs and emission inventories.
The D: EA&DP will continue to work closely with the District Municipalities to ensure that not only the
roles and responsibilities are understood by all, but also that AQMPs are developed and implemented,
STATE OF AIR QUALITY MANAGEMENT: WESTERN CAPE 2014
18
while AQOs are designated at all Municipalities in the Province. The aim is to have 31 AQOs designated
in the Western Cape. To date, 26 out of 31 AQOs have been designated, inclusive of the Provincial
AQO. Further, all Municipalities are required to have approved AQMPs, as per the NEM: AQA. To date,
the Western Cape has 14 approved AQMPs and 10 draft AQMPs, with seven AQMPs not developed.
Environmental Management Inspectors (EMI’s) at Municipal level
The designation of EMI’s at municipal level improved during 2014. Municipality’s requested training and
have sent officials on EMI training courses. It is suggested that implementation plans must be in place
between MECs and Executive Councils to avoid conflict situations with regard to EMI designations.
Co-operative Governance within Municipalities
AEL applications and air quality management in general, requires co-operation from various disciplines
within local government, which includes amongst others, town planning, municipal health, fire and
rescue, engineering, building control and traffic. The successful implementation of air quality
management is thus strongly dependent upon co-operation and communication amongst all sectors
and all local governments within the districts.
STATE OF AIR QUALITY MANAGEMENT: WESTERN CAPE 2014
19
1. AMBIENT AIR QUALITY MONITORING
1.1. PROVINCIAL AMBIENT AIR QUALITY MONITORING NETWORK
In terms of Section 8 of the National Environmental Management: Air Quality Act, No. 39 of 2004
(NEM: AQA), it is the function of Provinces and Municipalities to monitor ambient air quality. Within the
Western Cape, extensive ambient air quality monitoring is done by the Western Cape Government
(WCG) and the City of Cape Town (CoCT). The WCG’s Department of Environmental Affairs and
Development Planning (D: EA&DP) commenced with ambient air quality monitoring in 2008, as part of
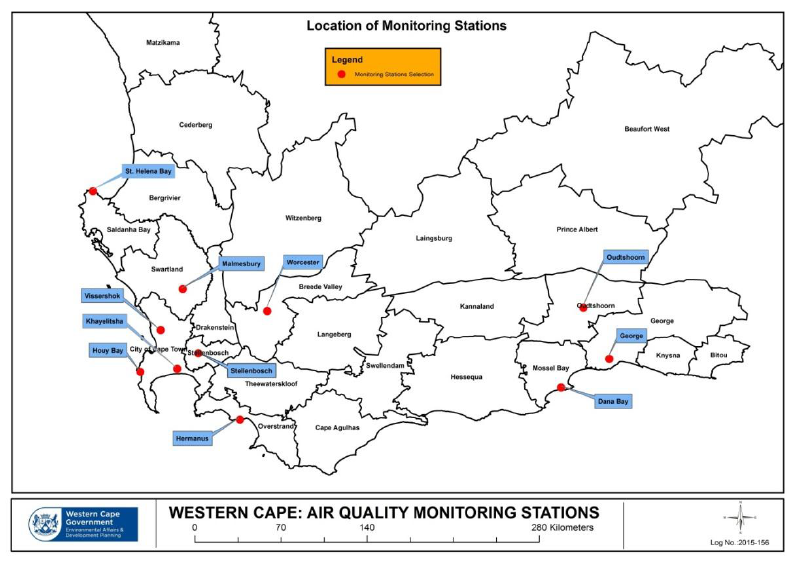
the Western Cape Ambient Air Quality Monitoring Network. To date eleven (11) fully equipped
ambient air quality monitoring stations are in operation across the Province (Figure 1-1). The City of
Cape Town, which has been monitoring ambient air quality since the early sixties, is independently
operating a network comprising 11 monitoring stations (see Section 1.2).
Figure 1-1: Location of ambient air quality monitoring stations maintained by D: EA&DP
The ambient air quality analysers used in both networks are United States Environmental Protection
Agency (US EPA) approved and are operated in accordance with the US EPA monitoring methods and
SANAS ISO 17025 requirements. Spectrometric and chemiluminescent technology is used to
continuously measure Sulphur Dioxide (SO
2
), Nitrous Oxide (NO), Nitrous Dioxide (NO
2
), Oxides of
Nitrogen (NO
x
), Ozone (O
3
), Carbon Monoxide (CO), Carbon Dioxide (CO
2
) and Hydrogen Sulphide
(H
2
S). Particulate Matter (PM
10
) monitoring is done by means of a Tapered Element Oscillating Mass
(TEOM) balance to continuously weigh particles of less than 10µm in diameter in the sampled air.
VOC’s (benzene, toluene, ethylbenzene and xylene) are monitored using Gas Chromatography (GC)
technology.
The ambient air is measured on a continuous basis every 10 seconds and all data is collected on a
central server. The data is processed daily to 1 minute, 10 minute, 15 minute, 1 hour, 8 hour and 24
hourly (daily) averages. These averages are compared against the South African Ambient Air Quality
Standards (SA-AAQS) (NEM: AQA), Section 3 of G.N. 1210 on 24 December 2009) and are compiled
and reported on a monthly basis. The Western Cape Ambient Air Quality Monitoring Network reports
data to the South African Air Quality Information System (SAAQIS).
In terms of air quality management, data collection/capture and transfer, data evaluation and
validation, daily and monthly reporting, assessments on faulty equipment and calibrations on analysers
STATE OF AIR QUALITY MANAGEMENT: WESTERN CAPE 2014
20
and meteorological stations were undertaken during 2014. However, faulty data loggers, loss of
electricity supply to monitoring stations and faulty instruments were experienced, which has resulted in
incomplete data sets at stations.
The 2014 data was validated and evaluated against the SA-AAQS and are presented for each
monitoring station. Instrument failure and power outages resulted in low data recovery at St Helena
Bay, Worcester and Stellenbosch. The Khayelitsha monitoring station was decommissioned, as the site
was earmarked for development by the City of Cape Town. After an extensive site selection process, a
new location (Khayelitsha District Hospital), less than five kilometres from the old site, was identified and
the site preparation and station relocation was completed during December 2014. Due to the station
relocation taking place during December 2014 no data is reported for the 2014 year. Scatter graphs
are presented for each station since commissioning of the stations to evaluate the long term trends. In
terms of the pollutants of concern, viz. PM
10
and SO
2
, in the Western Cape, there were no exceedances
recorded during the 2014 year of reporting. The Hermanus and Hout Bay stations were commissioned in
March 2014.
In terms of abattoirs, tanneries, fishmeal processing, or sewage treatment works, it is not possible to
monitor odour per say; as such, H
2
S is used as an indicator, as the said industries emit H
2
S amongst other
odorous gases. In the absence of a SA-AAQS for H
2
S, the World Health Organization (WHO) guideline
(WHO Air Quality Guidelines for Europe - 2nd edition; 2000) for H
2
S of 150 µg/m
3
for an average
concentration over 24 hour (CIDAC53, WHO 2003), is used for health impact evaluation.
Table 1-1: Location of the Western Cape Province Ambient Air Quality Monitoring Stations
Municipality
Location
Month/Year
Commenced
Cape Winelands
Meirings Park Electrical Substation, Worcester
July 2009
West Coast
Swartland High School, Malmesbury
April 2010
Eden
Municipal Swimming Pool, George
July 2010
Eden
Bongolethu Clinic, Oudtshoorn
April 2011
West Coast
HP Williams Primary School, St Helena Bay
April 2011
City of Cape Town
Khayelitsha Training Centre, Khayelitsha
May 2011
City of Cape Town
Morningstar Small Holdings, Vissershok
September 2011
Cape Winelands
Cape Winelands District Municipality Office, Stellenbosch
October 2011
Eden
Dana Bay Reservoir, Dana Bay
November 2011
City of Cape Town
Sentinel Primary School, Hout Bay
March 2014
Overberg
Mount Pleasant Primary School, Hermanus
March 2014
1.1.1. St. Helena Bay (West Coast District, Saldanha Bay Municipality)
The St. Helena Bay monitoring station was commissioned at the HP Williams Primary School during April
2011 and was operational during the period 01 January – 31 December 2014. The station is located at
17° 58' 21.74” East and 32° 43' 24.03" South (Figure 1-2). The monitoring station is located in a residential
area, downwind of the fishing industries in the area. H
2
S levels measured at St. Helena Bay were below
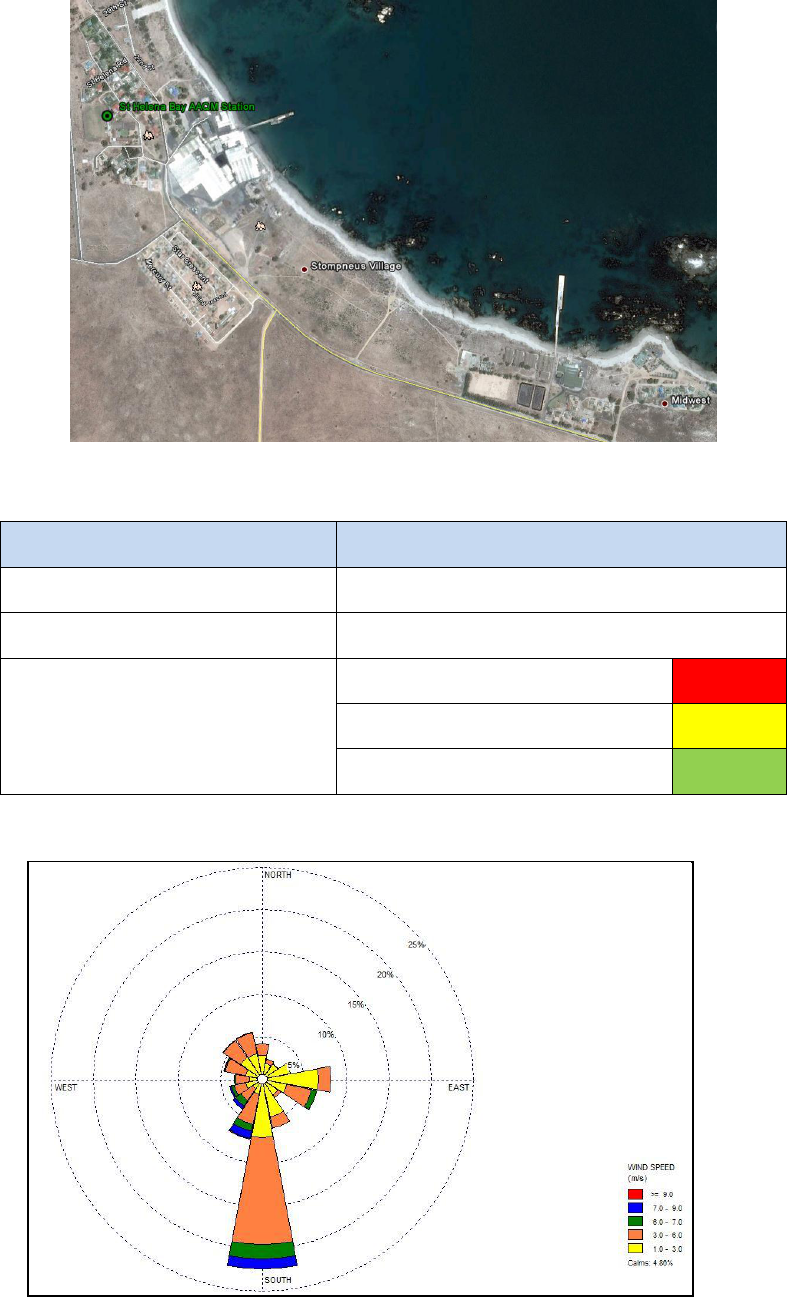
150 µg/m³ in terms of the WHO air quality guideline for health impact evaluation. The wind rose (Figure
1-3) shows a predominantly southerly wind direction for the period monitored. Data capture for CO
2
measured during 2014 was less than 60% and is not presented in this report. Data loss for CO
2
and H
2
S
were due to instrument failures (Table 1-2).
STATE OF AIR QUALITY MANAGEMENT: WESTERN CAPE 2014
21
Figure 1-2: Aerial image of St. Helena Bay Ambient Air Quality Monitoring location
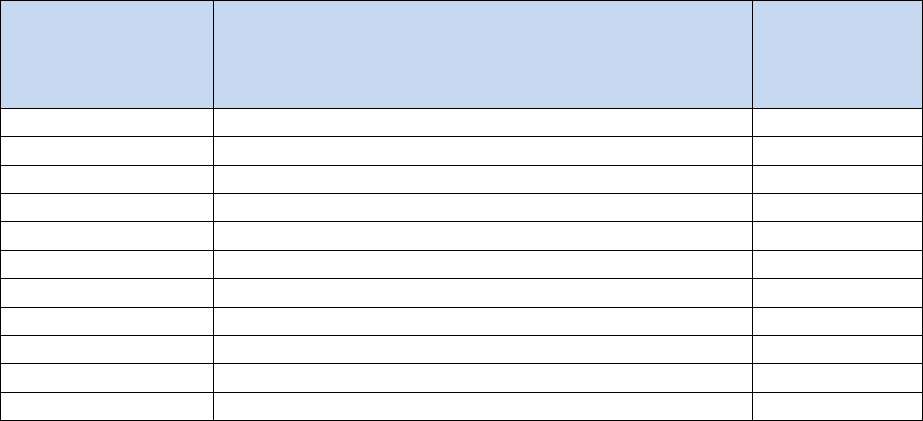
Table 1-2: St. Helena Bay Data Capture after quality control (2014)
Measurement
% Data Capture
Carbon Dioxide (CO
2
)
<60
Hydrogen Sulphide (H
2
S)
66
Legend Description on Graphs
Power Failure
Data Capture Failure
Instrument Failure
Figure 1-3: Annual Wind Rose for St. Helena Bay (2014)
STATE OF AIR QUALITY MANAGEMENT: WESTERN CAPE 2014
22
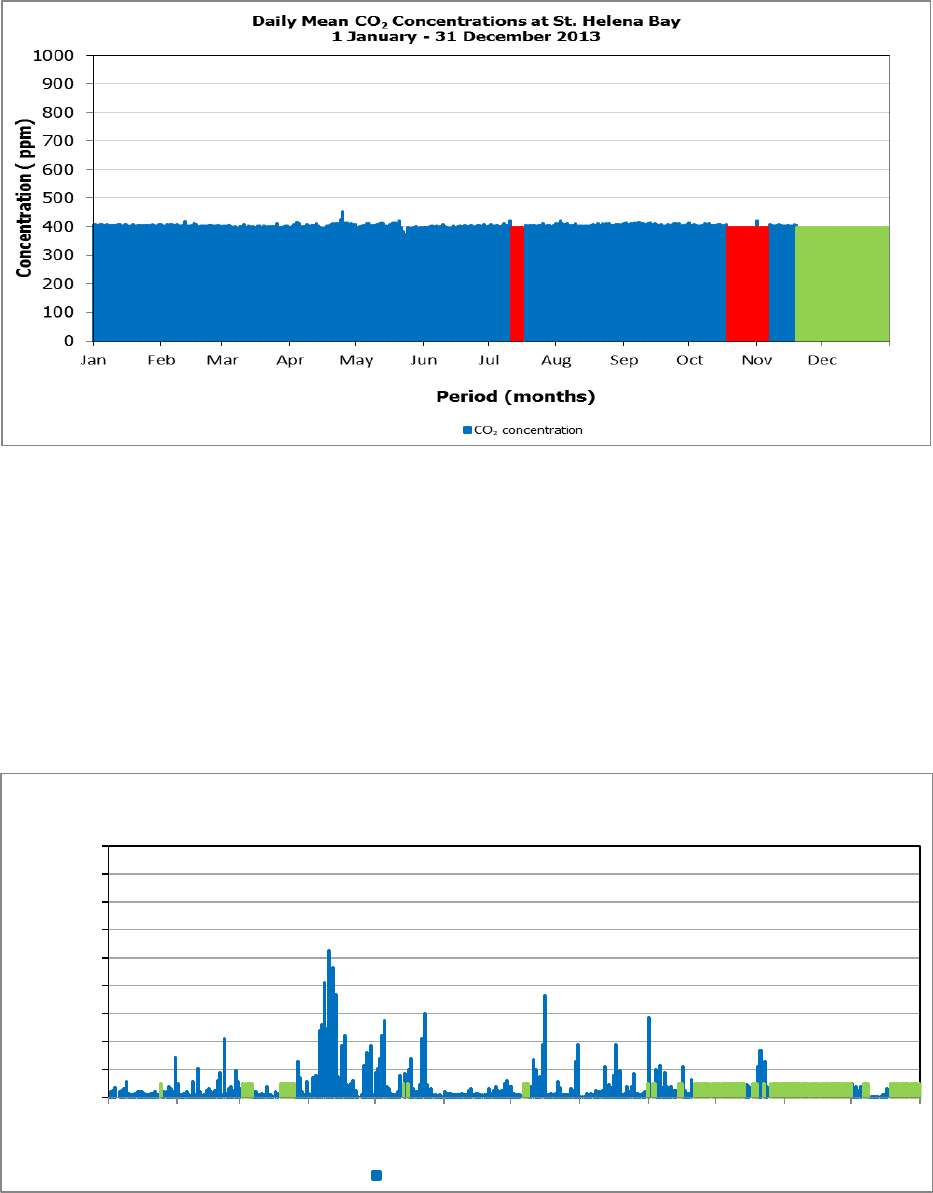
1.1.1.1. Carbon Dioxide (CO
2
)
During the 2014 period, the CO
2
analyser was faulty and therefore CO
2
levels were not measured. The
CO
2
concentrations measured at the St. Helena Bay monitoring station in 2013 are presented in Figure
1-4.
Figure 1-4: Daily Mean CO
2
at St. Helena Bay
1.1.1.2. Hydrogen Sulphide (H
2
S)
The monitoring of H
2
S is used as an indicator of odour emissions from industrial activities. The daily
maximum hourly mean H
2
S concentrations measured at the St. Helena Bay monitoring station is
presented in Figure 1-5. The highest H
2
S level recorded during this period was 105 µg/m³ on 10 April
2014. The H
2
S peaks can likely be attributed to the industries operating in the St. Helena Bay area. The
readings were reported and discussed at the quarterly West Coast District Municipality (WCDM) Air
Quality Officer’s Forum meetings, together with industry and community representatives.
Figure 1-5: Daily Maximum H
2
S (Hourly Mean) at St. Helena Bay (2014)
0
20
40
60
80
100
120
140
160
180
Jan Feb Mar Apr May Jun Jul Aug Sep Oct Nov Dec
Concentration (µg/m
3
)
Period (months)
Daily Maximum Hourly Mean for H
2
S at St. Helena Bay
1 January 2014- 31 December 2014
H2S concentration µg/m3
STATE OF AIR QUALITY MANAGEMENT: WESTERN CAPE 2014
23
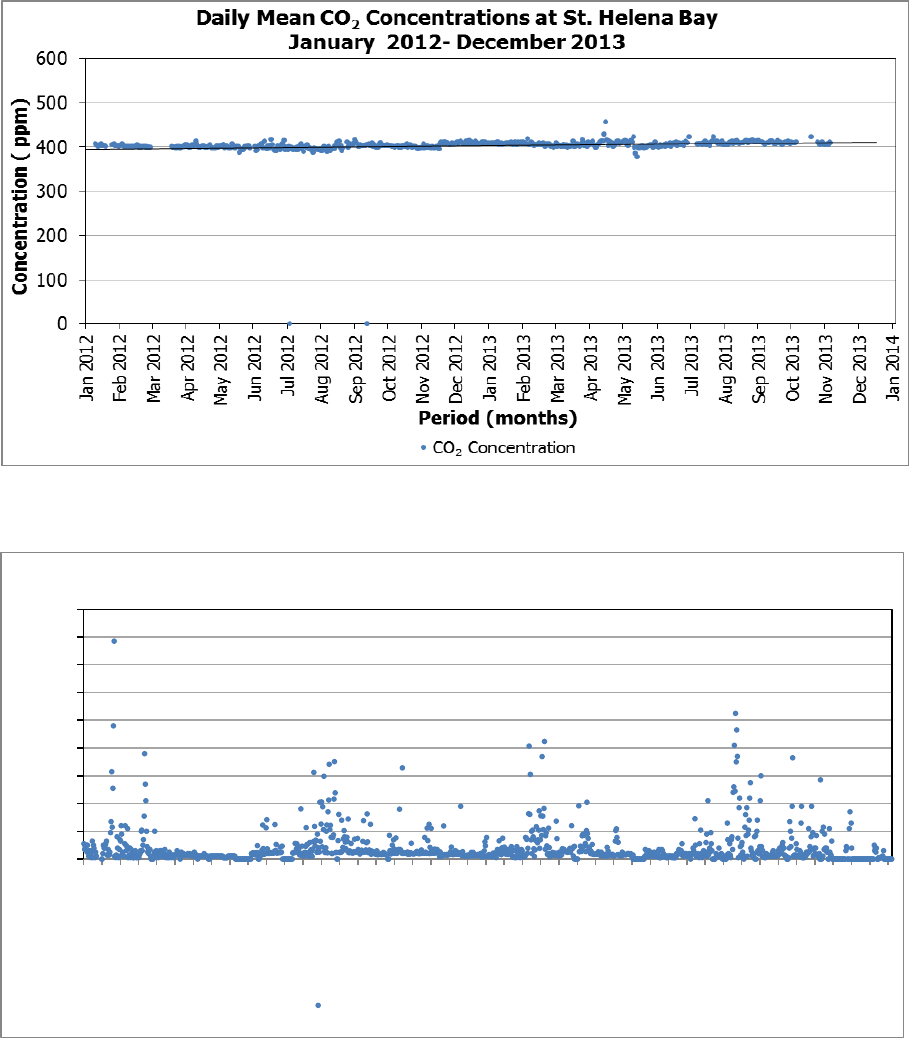
1.1.1.3. Long term air quality trends for St. Helena Bay
The long term CO
2
data monitored at St. Helena Bay shows a steady concentration of about 430 ppm
(Figure 1-6), which approximates that of the global baseline of 400 ppm.
The H
2
S concentrations measured at the St. Helena Bay monitoring station (Figure 1-7) shows a steady
value of approximately 8 µg/m³.
Figure 1-6: Long term CO
2
trend at St. Helena Bay
Figure 1-7: Long term H
2
S trend at St. Helena Bay
1.1.2. Malmesbury (West Coast District, Swartland Municipality)
The Malmesbury monitoring station is located at the Swartland High School in Malmesbury. The station is
located at 18° 43’ 54.62” East and 33° 27’ 19.51” South (Figure 1-8). The station was commissioned in
0
20
40
60
80
100
120
140
160
180
Apr 2011
May 2011
Jun 2011
Jul 2011
Aug 2011
Sep 2011
Oct 2011
Nov 2011
Dec 2011
Jan 2012
Feb 2012
Mar 2012
Apr 2012
May 2012
Jun 2012
Jul 2012
Aug 2012
Sep 2012
Oct 2012
Nov 2012
Dec 2012
Jan 2013
Feb 2013
Mar 2013
Apr 2013
May 2013
Jun 2013
Jul 2013
Aug 2013
Sep 2013
Oct 2013
Nov 2013
Dec 2013
Jan 2014
Feb 2014
Mar 2014
Apr 2014
May 2014
Jun 2014
Jul 2014
Aug 2014
Sep 2014
Oct 2014
Nov 2014
Dec 2014
Concentration (µg/m
3
)
Period (months)
Daily Maximum Hourly Mean for H
2
S at St. Helena Bay
April 2011 - December 2014
H2S concentration µg/m3
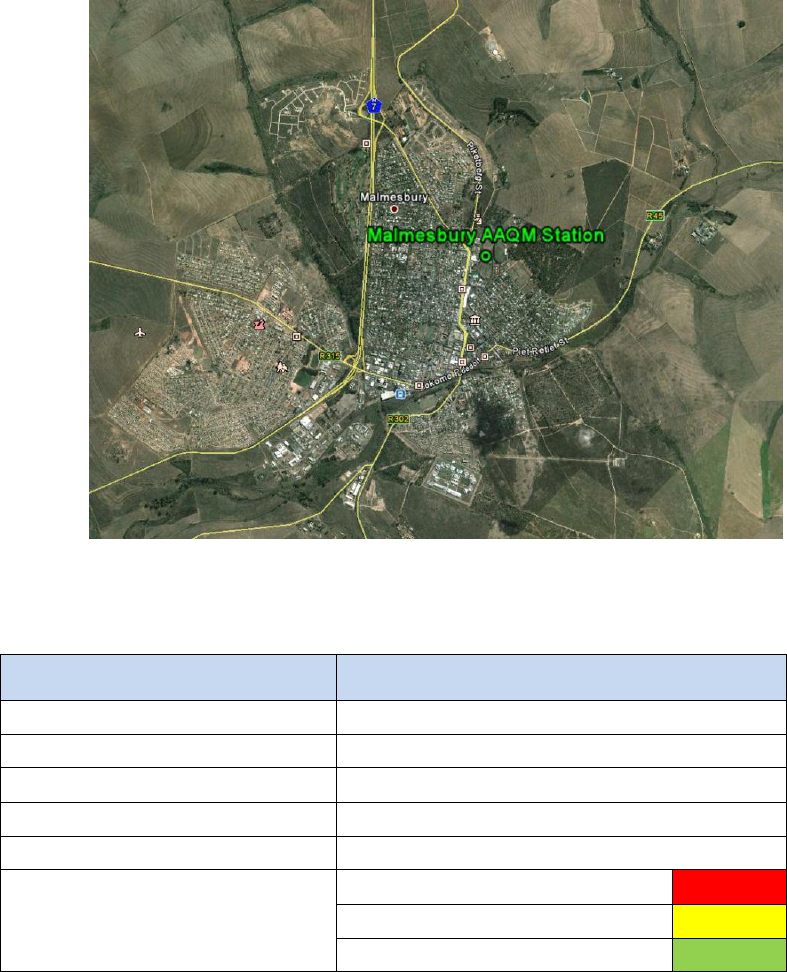
STATE OF AIR QUALITY MANAGEMENT: WESTERN CAPE 2014
24
April 2010 and is located in a residential area, downwind of industries, a central business district and the
N7 National Road. The wind rose (Figure 1-9) shows a predominantly southerly wind direction for the
period monitored. The data recovery is indicated in Table 1-3. Long term trends in air quality are
reported for all parameters measured (Figure 1-13 to Figure 1-17).
Figure 1-8: Aerial image of Malmesbury Ambient Air Quality Monitoring location
Table 1-3: Malmesbury Data Capture after quality control (2014)
Measurement
% Data Capture
Carbon Monoxide (CO)
78
Ozone (O
3
)
70
Nitrogen Dioxide (NO
2
)
76
Sulphur Dioxide (SO
2
)
62
Particulates (PM
10
)
76
Legend Description on Graphs
Power Failure
Data Capture Failure
Instrument Failure
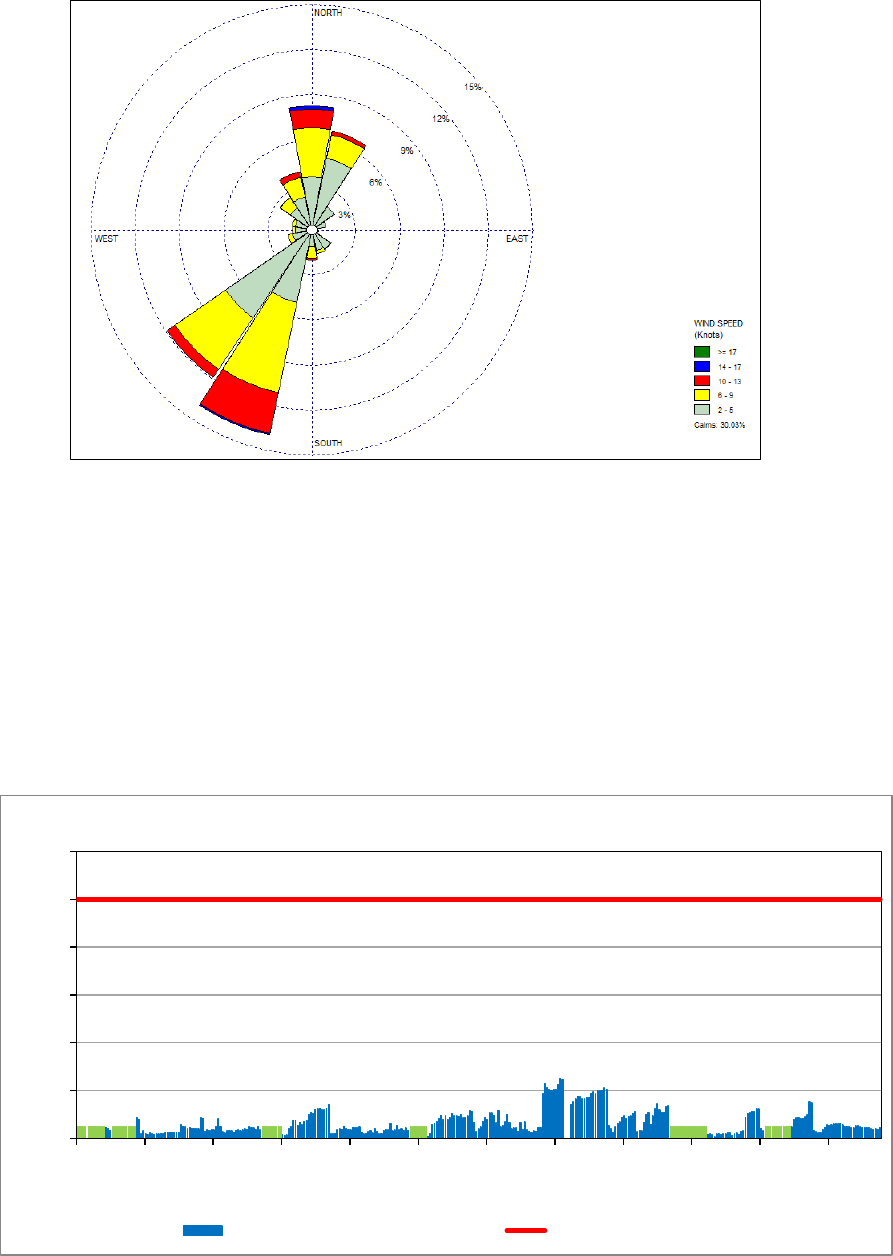
STATE OF AIR QUALITY MANAGEMENT: WESTERN CAPE 2014
25
Figure 1-9: Annual Wind Rose for Malmesbury (2014)
1.1.2.1. Carbon Monoxide (CO)
The CO concentrations measured at the Malmesbury monitoring station are presented in
Figure 1-10. Overall, the CO levels remained well below the SA-AAQS of 10 mg/m³ (RSA, 2009) during 1
January – 31 December 2014. The CO (8 – hour) SA-AAQS of 10 mg/m³ (RSA, 2009) was not exceeded
during the monitoring period. The intermittent breaks in the data were as a result of electricity/power
failures.
Figure 1-10: Daily Maximum CO (8 – hour Mean) at Malmesbury (2014)
1.1.2.2. Ozone (O
3
)
The O
3
concentrations measured at the Malmesbury monitoring station was not exceeded during this
period (Figure 1-11). Elevated levels can likely be attributed to the rising temperatures and the
interaction with industrial and vehicle emissions in the area. The highest recorded 8-hourly O
3
mean of
0
2
4
6
8
10
12
Jan Feb Mar Apr May Jun Jul Aug Sep Oct Nov Dec
Concentration (mg/m
3
)
Period (months)
Daily Maximum 8-hr Mean Concentrations for CO at Malmesbury
1 January - 31 December 2014
CO Concentration SA Ambient AQ Standard
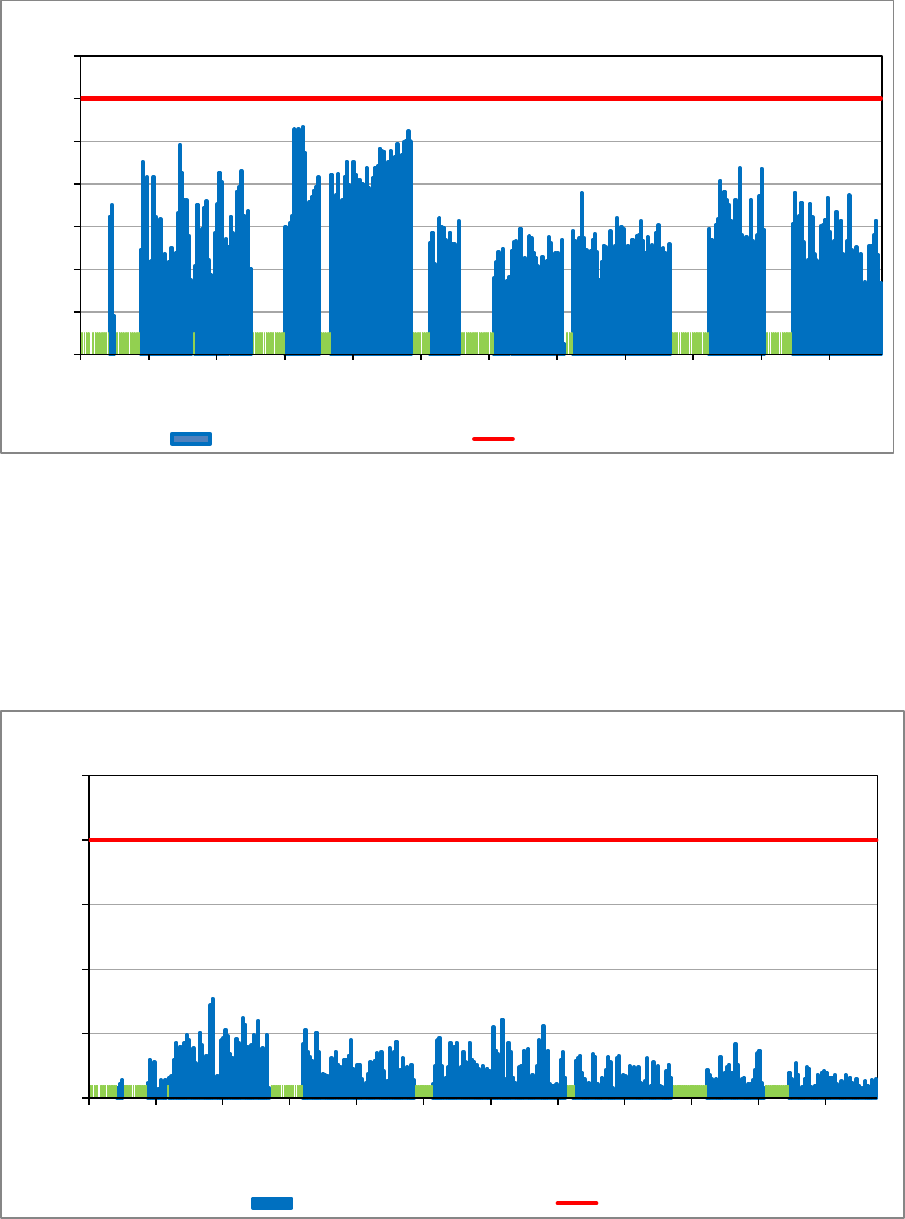
STATE OF AIR QUALITY MANAGEMENT: WESTERN CAPE 2014
26
105.75 µg/m
3
was recorded on 8 April 2014. The intermittent gaps in the data were as a result of
equipment failures.
Figure 1-11: Daily Maximum O
3
(8 – hour Mean) at Malmesbury (2014)
1.1.2.3. Nitrogen Dioxide (NO
2
)
The NO
2
concentrations measured at the Malmesbury monitoring station are presented in Figure 1-12.
There were no exceedances of the NO
2
(1 – hour) SA-AAQS of 200 µg/m³ (RSA, 2009). The intermittent
gaps in the data were as a result of equipment and/or electrical/power failures.
Figure 1-12: Mean NO
2
concentrations (1 – hour) at Malmesbury (2014)
0
20
40
60
80
100
120
140
Jan Feb Mar Apr May Jun Jul Aug Sep Oct Nov Dec
Concentration (µg/m
3
)
Period (months)
Daily Maximum 8-hr Mean Concentrations for O
3
at Malmesbury
1 January - 31 December 2014
O3 Concentration SA Ambient AQ Standard
0
50
100
150
200
250
Jan Feb Mar Apr May Jun Jul Aug Sep Oct Nov Dec
Concentration (µg/m
3
)
Period (months)
Daily Maximum Hourly Mean for NO
2
at Malmesbury
1 January - 31 December 2014
NO2 Concentration SA Ambient AQ Standard
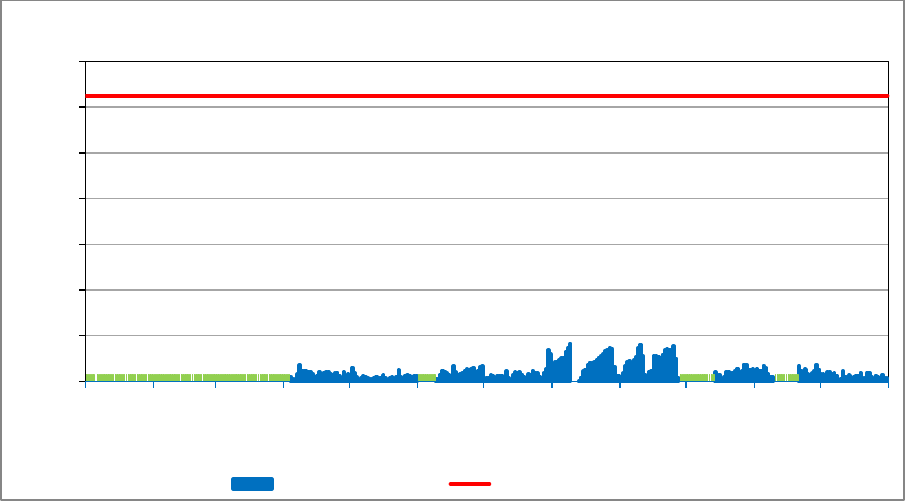
STATE OF AIR QUALITY MANAGEMENT: WESTERN CAPE 2014
27
1.1.2.4. Sulphur Dioxide (SO
2
)
The SO
2
concentrations measured at the Malmesbury monitoring station are presented in Figure 1-12.
There were no exceedances of the SO
2
(1 – hour) SA-AAQS of 125 µg/m³ (RSA, 2009). The intermittent
gaps in the data were as a result of equipment failures.
Figure 1-13: Mean SO
2
concentrations (1 – hour) at Malmesbury (2014)
1.1.2.5. Particulate Matter (PM
10
)
The PM
10
concentrations measured at Malmesbury are presented in Figure 1-14. There were no
exceedances of the PM
10
(24 – hours) SA-AAQS of 120 µg/m³ or the proposed SA-AAQS of 75 µg/m³
(2015). The break in data was as a result of equipment failures.
0
20
40
60
80
100
120
140
Jan Feb Mar Apr May Jun Jul Aug Sep Oct Nov Dec
Concentration ( µg/m
3
)
Period (months)
Daily Mean SO
2
Concentrations at Malmesbury
1 January - 31 December 2014
SO2 concentration SA Ambient AQ Standard
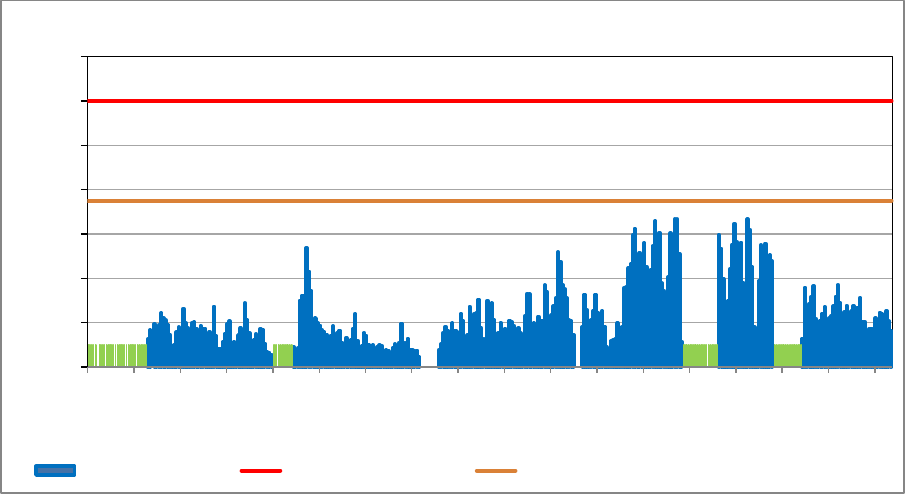
STATE OF AIR QUALITY MANAGEMENT: WESTERN CAPE 2014
28
Figure 1-14: Daily Mean PM
10
concentrations (24 – hour) at Malmesbury (2014)
1.1.2.6. Long term air quality data for Malmesbury
The long term Malmesbury CO data (Figure 1-15) shows a steady average of approximately 0.5 mg/m³
over the four year measurement period.
The long term Malmesbury O
3
data (Figure 1-16) shows a steady decline from approximately 65 µg/m³
to 40 µg/m³ over the four year measurement period.
The long term Malmesbury NO
2
data (Figure 1-17) shows a steady average data of approximately 20
µg/m³ over the four year measurement period.
The long term Malmesbury SO
2
data (Figure 1-18) shows a steady average data of 3 µg/m³ over the
four year measurement period.
The long term Malmesbury PM
10
data (Figure 1-19) shows a steady decline from approximately 25
µg/m³ to 10 µg/m³ over the four year measurement period.
0
20
40
60
80
100
120
140
Jan Jan Feb Mar Mar Apr May May Jun Jul Jul Aug Sep Oct Oct Nov Dec Dec
Concentration (µg/m
3
)
Period (months)
Daily Mean PM
10
Concentrations at Malmesbury
1 January - 31 December 2014
PM10 Concentration SA Ambient AQ Standard Proposed SA Ambient Air Quality Standard for 2015
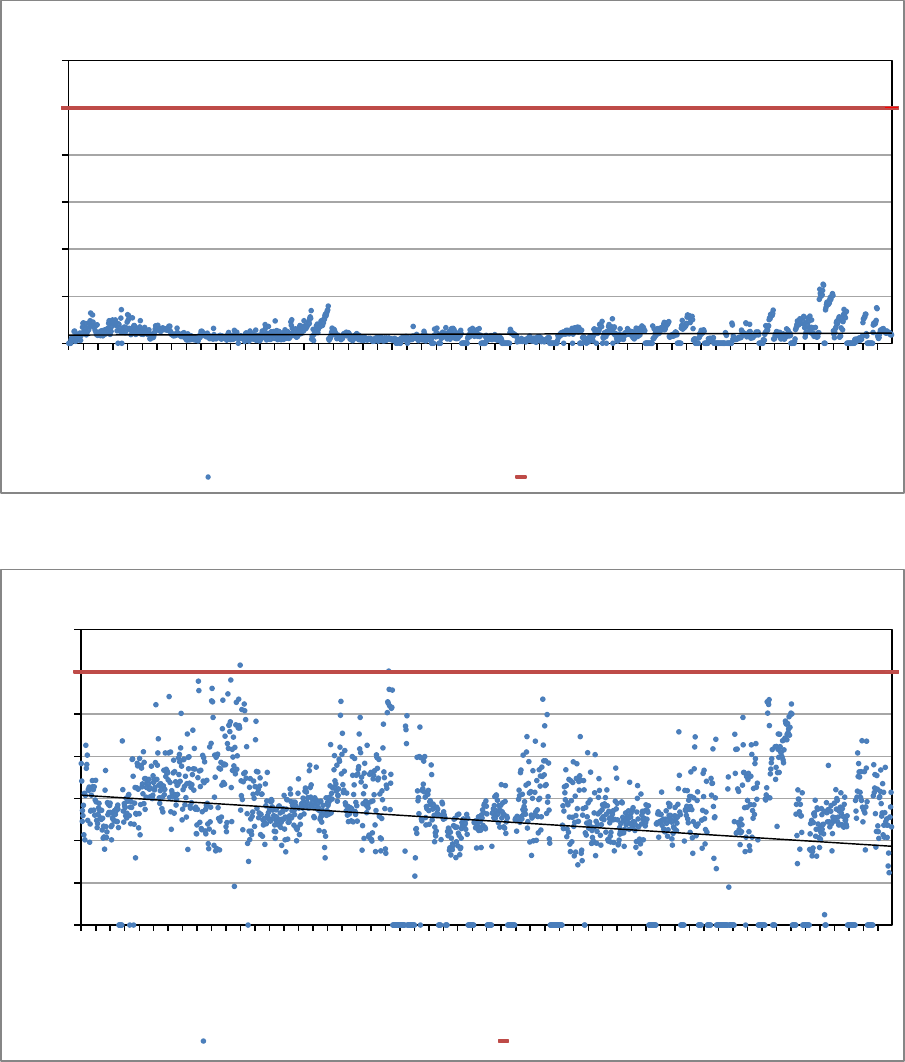
STATE OF AIR QUALITY MANAGEMENT: WESTERN CAPE 2014
29
Figure 1-15: Long Term CO trend at Malmesbury (April 2010 – Dec 2014)
Figure 1-16: Long Term O
3
trend at Malmesbury (April 2010 – Dec 2014)
0
2
4
6
8
10
12
Apr 2010
May 2010
Jun 2010
Jul 2010
Aug 2010
Sep 2010
Oct 2010
Nov 2010
Dec 2010
Jan 2011
Feb 2011
Mar 2011
Apr 2011
May 2011
Jun 2011
Jul 2011
Aug 2011
Sep 2011
Oct 2011
Nov 2011
Dec 2011
Jan 2012
Feb 2012
Mar 2012
Apr 2012
May 2012
Jun 2012
Jul 2012
Aug 2012
Sep 2012
Oct 2012
Nov 2012
Dec 2012
Jan 2013
Feb 2013
Mar 2013
Apr 2013
May 2013
Jun 2013
Jul 2013
Aug 2013
Sep 2013
Oct 2013
Nov 2013
Dec 2013
Jan 2014
Feb 2014
Mar 2014
Apr 2014
May 2014
Jun 2014
Jul 2014
Aug 2014
Sep 2014
Oct 2014
Nov 2014
Concentration (mg/m
3
)
Period (months)
Daily Maximum 8-hr Mean Concentrations for CO at Malmesbury
April 2010 - December 2014
CO Concentration SA Ambient AQ Standard
0
20
40
60
80
100
120
140
Apr 2010
May 2010
Jun 2010
Jul 2010
Aug 2010
Sep 2010
Oct 2010
Nov 2010
Dec 2010
Jan 2011
Feb 2011
Mar 2011
Apr 2011
May 2011
Jun 2011
Jul 2011
Aug 2011
Sep 2011
Oct 2011
Nov 2011
Dec 2011
Jan 2012
Feb 2012
Mar 2012
Apr 2012
May 2012
Jun 2012
Jul 2012
Aug 2012
Sep 2012
Oct 2012
Nov 2012
Dec 2012
Jan 2013
Feb 2013
Mar 2013
Apr 2013
May 2013
Jun 2013
Jul 2013
Aug 2013
Sep 2013
Oct 2013
Nov 2013
Dec 2013
Jan 2014
Feb 2014
Mar 2014
Apr 2014
May 2014
Jun 2014
Jul 2014
Aug 2014
Sep 2014
Oct 2014
Nov 2014
Concentration (µg/m
3
)
Period (months)
Daily Maximum 8-hr Mean Concentrations for O
3
at Malmesbury
April 2010 - December 2014
O3 Concentration SA Ambient AQ Standard
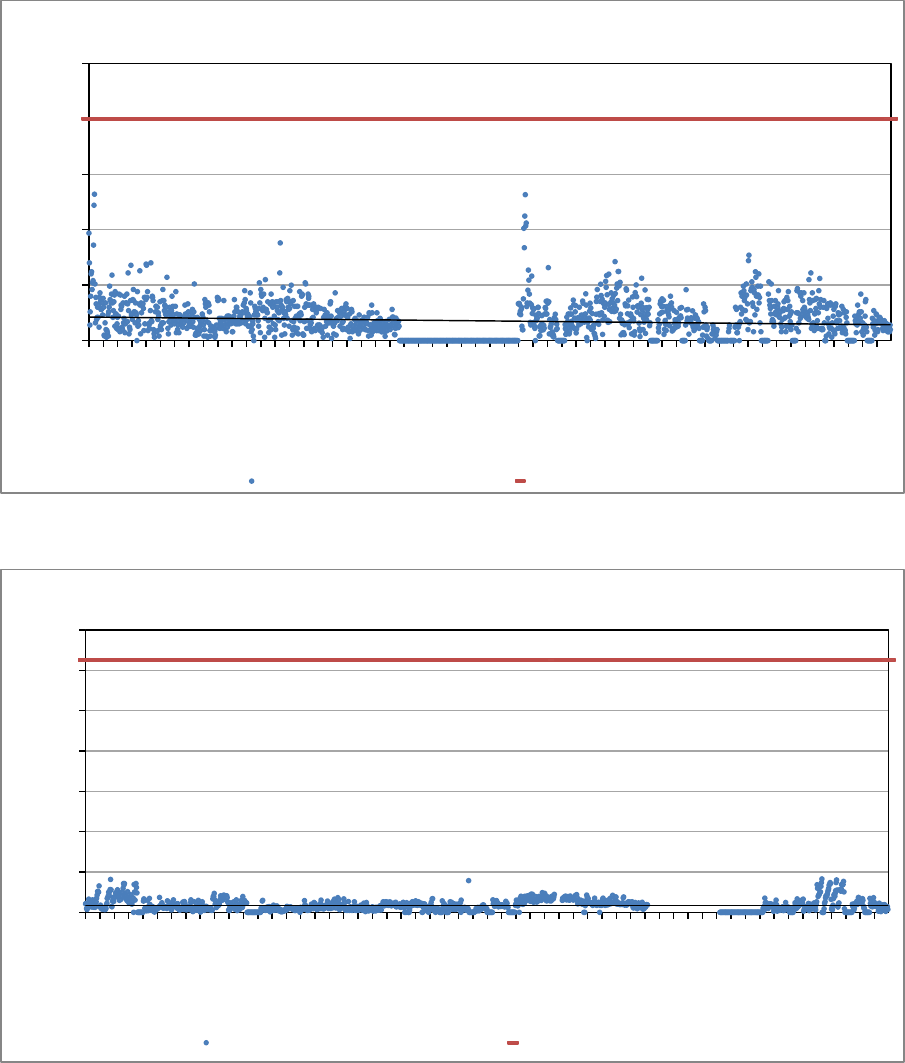
STATE OF AIR QUALITY MANAGEMENT: WESTERN CAPE 2014
30
Figure 1-17: Long Term NO
2
trend at Malmesbury (April 2010 – Dec 2014)
Figure 1-18: Long Term SO
2
trend at Malmesbury (April 2010 – Dec 2014)
0
50
100
150
200
250
Apr 2010
May 2010
Jun 2010
Jul 2010
Aug 2010
Sep 2010
Oct 2010
Nov 2010
Dec 2010
Jan 2011
Feb 2011
Mar 2011
Apr 2011
May 2011
Jun 2011
Jul 2011
Aug 2011
Sep 2011
Oct 2011
Nov 2011
Dec 2011
Jan 2012
Feb 2012
Mar 2012
Apr 2012
May 2012
Jun 2012
Jul 2012
Aug 2012
Sep 2012
Oct 2012
Nov 2012
Dec 2012
Jan 2013
Feb 2013
Mar 2013
Apr 2013
May 2013
Jun 2013
Jul 2013
Aug 2013
Sep 2013
Oct 2013
Nov 2013
Dec 2013
Jan 2014
Feb 2014
Mar 2014
Apr 2014
May 2014
Jun 2014
Jul 2014
Aug 2014
Sep 2014
Oct 2014
Dec 2014
Concentration (µg/m
3
)
Period (months)
Daily Maximum Hourly Mean for NO
2
at Malmesbury
April 2010 - December 2014
NO2 Concentration SA Ambient AQ Standard
0
20
40
60
80
100
120
140
Apr 2010
May 2010
Jun 2010
Jul 2010
Aug 2010
Sep 2010
Oct 2010
Nov 2010
Dec 2010
Jan 2011
Feb 2011
Mar 2011
Apr 2011
May 2011
Jun 2011
Jul 2011
Aug 2011
Sep 2011
Oct 2011
Nov 2011
Dec 2011
Jan 2012
Feb 2012
Mar 2012
Apr 2012
May 2012
Jun 2012
Jul 2012
Aug 2012
Sep 2012
Oct 2012
Nov 2012
Dec 2012
Jan 2013
Feb 2013
Mar 2013
Apr 2013
May 2013
Jun 2013
Jul 2013
Aug 2013
Sep 2013
Oct 2013
Nov 2013
Dec 2013
Jan 2014
Feb 2014
Mar 2014
Apr 2014
May 2014
Jun 2014
Jul 2014
Aug 2014
Sep 2014
Oct 2014
Dec 2014
Concentration ( µg/m
3
)
Period (months)
Daily Mean SO
2
Concentrations at Malmesbury
April 2010 - December 2014
SO2 concentration SA Ambient AQ Standard
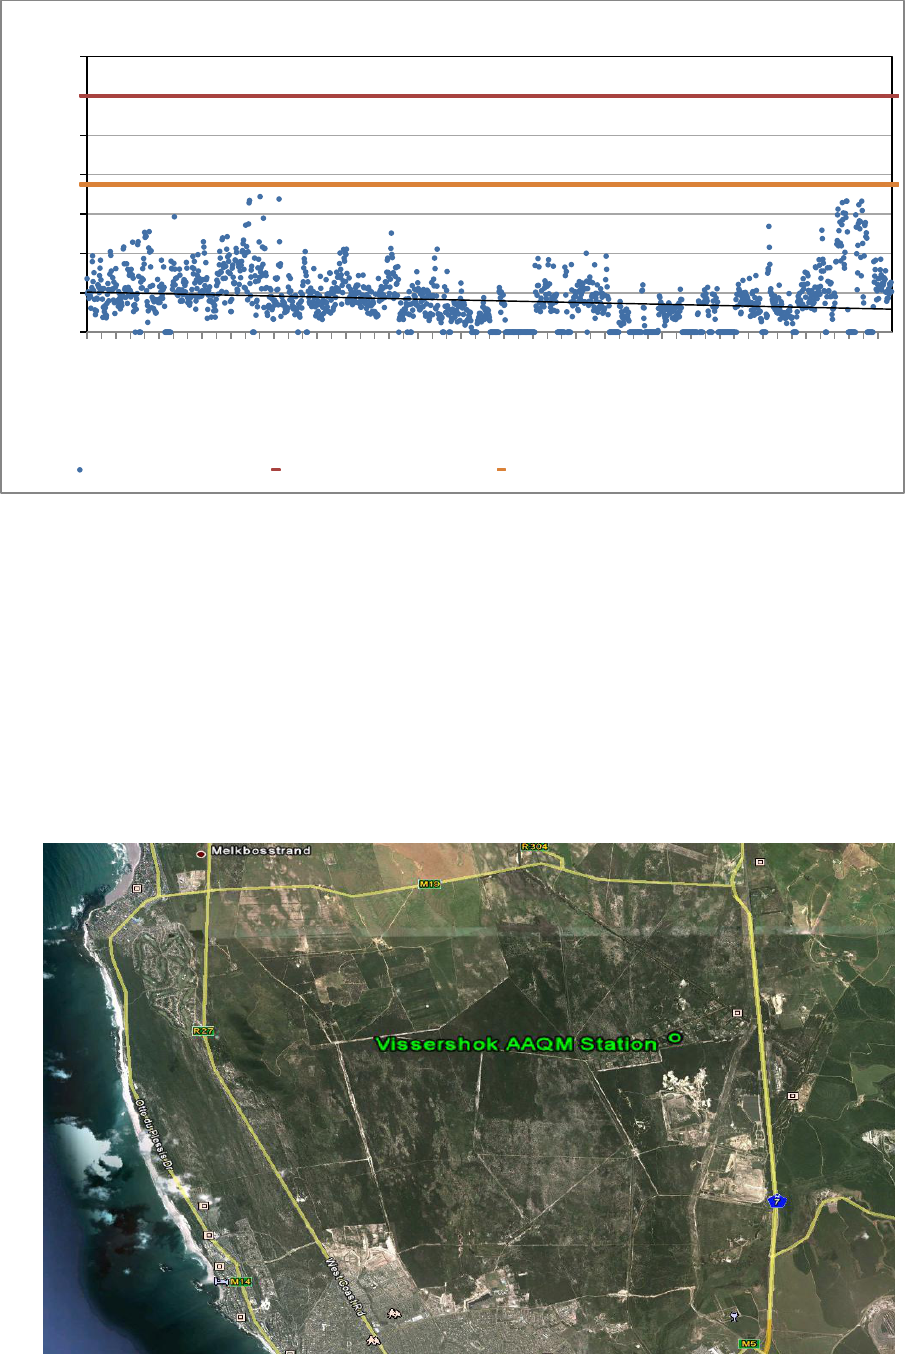
STATE OF AIR QUALITY MANAGEMENT: WESTERN CAPE 2014
31
Figure 1-19: Long Term PM
10
trend at Malmesbury (April 2010 – Dec 2014)
1.1.3. Vissershok (City of Cape Town)
The Vissershok ambient air quality monitoring station is located at a small-holding at Morningstar,
Vissershok, north-east of Cape Town. The site co-ordinates are 33°45’ 07.37”S, 18° 31’ 53.65”E (Figure
1-20). The station was commissioned during September 2011 and is located downwind of industries and
the N7 National Road. The monitoring station is equipped to continuously monitor NO
2
, PM
10
, O
3
and
CO. Data recovery for NO
2
and O
3
was less than 60% during 2014, as a result of equipment failure
and/or electrical/power failures; and are not reported here (Table 1-4). The wind rose in the (Figure
1-21) shows a predominantly southerly wind direction for the period monitored. Long term air quality
trends for O
3
, CO and NO
2
are provided for data collected from September 2011 (Figure 1-25 to Figure
1-28).
Figure 1-20: Aerial image of the Vissershok Ambient Air Quality Monitoring Location
0
20
40
60
80
100
120
140
Apr 2010
May 2010
Jun 2010
Jul 2010
Aug 2010
Sep 2010
Oct 2010
Nov 2010
Dec 2010
Jan 2011
Feb 2011
Mar 2011
Apr 2011
May 2011
Jun 2011
Jul 2011
Aug 2011
Sep 2011
Oct 2011
Nov 2011
Dec 2011
Jan 2012
Feb 2012
Mar 2012
Apr 2012
May 2012
Jun 2012
Jul 2012
Aug 2012
Sep 2012
Oct 2012
Nov 2012
Dec 2012
Jan 2013
Feb 2013
Mar 2013
Apr 2013
May 2013
Jun 2013
Jul 2013
Aug 2013
Sep 2013
Oct 2013
Nov 2013
Dec 2013
Jan 2014
Feb 2014
Mar 2014
Apr 2014
May 2014
Jun 2014
Jul 2014
Aug 2014
Sep 2014
Oct 2014
Dec 2014
Concentration (µg/m
3
)
Period (months)
Daily Mean PM
10
Concentrations at Malmesbury
April 2010- December 2014
PM10 Concentration SA Ambient AQ Standard Proposed SA Ambient Air Quality Standard for 2015
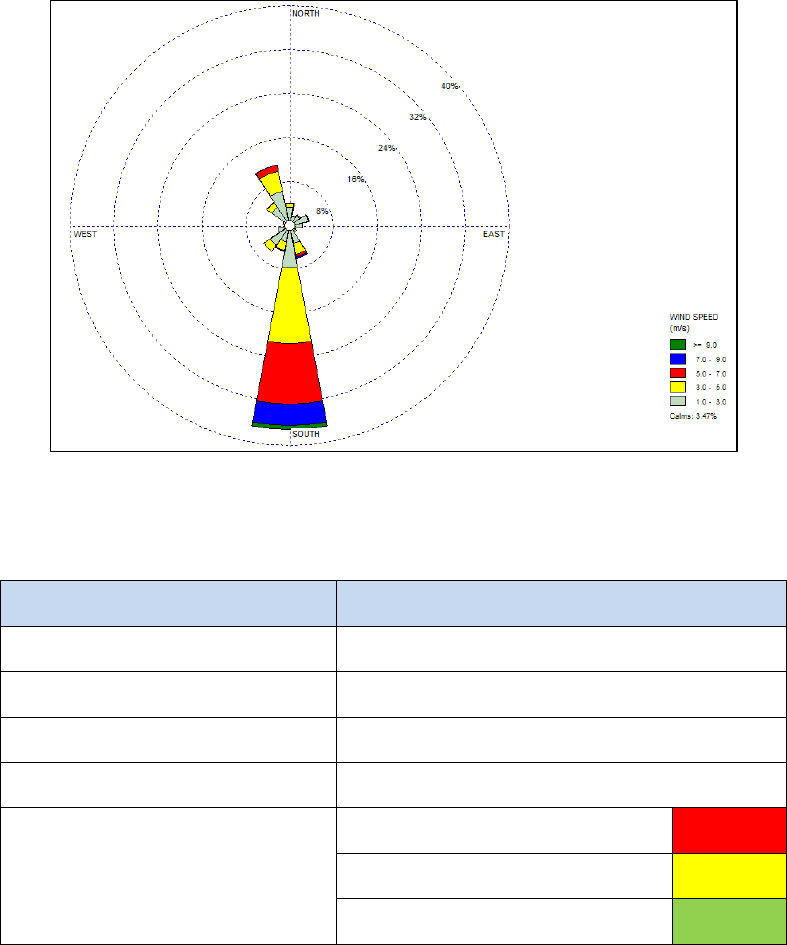
STATE OF AIR QUALITY MANAGEMENT: WESTERN CAPE 2014
32
Figure 1-21: Annual Wind Rose for Vissershok (2014)
Table 1-4: Vissershok Data Capture (2014)
Measurement
% Data Capture
Carbon Monoxide (CO)
76
Ozone (O
3
)
<60
Nitrogen Dioxide (NO
2
)
<60
Particulates (PM
10
)
68
Legend Description on Graphs
Power Failure
Data Capture Failure
Instrument Failure
1.1.3.1. Carbon Monoxide (CO)
The CO concentrations measured at the Vissershok monitoring station are presented in Figure 1-22.
Overall, the 8 – hour mean CO levels remained well below the SA-AAQS of 10 mg/m³ (RSA, 2009), and
did not exceed the standards during the monitoring period. The intermittent gaps in the data were as a
result of instrument failure and power problems.
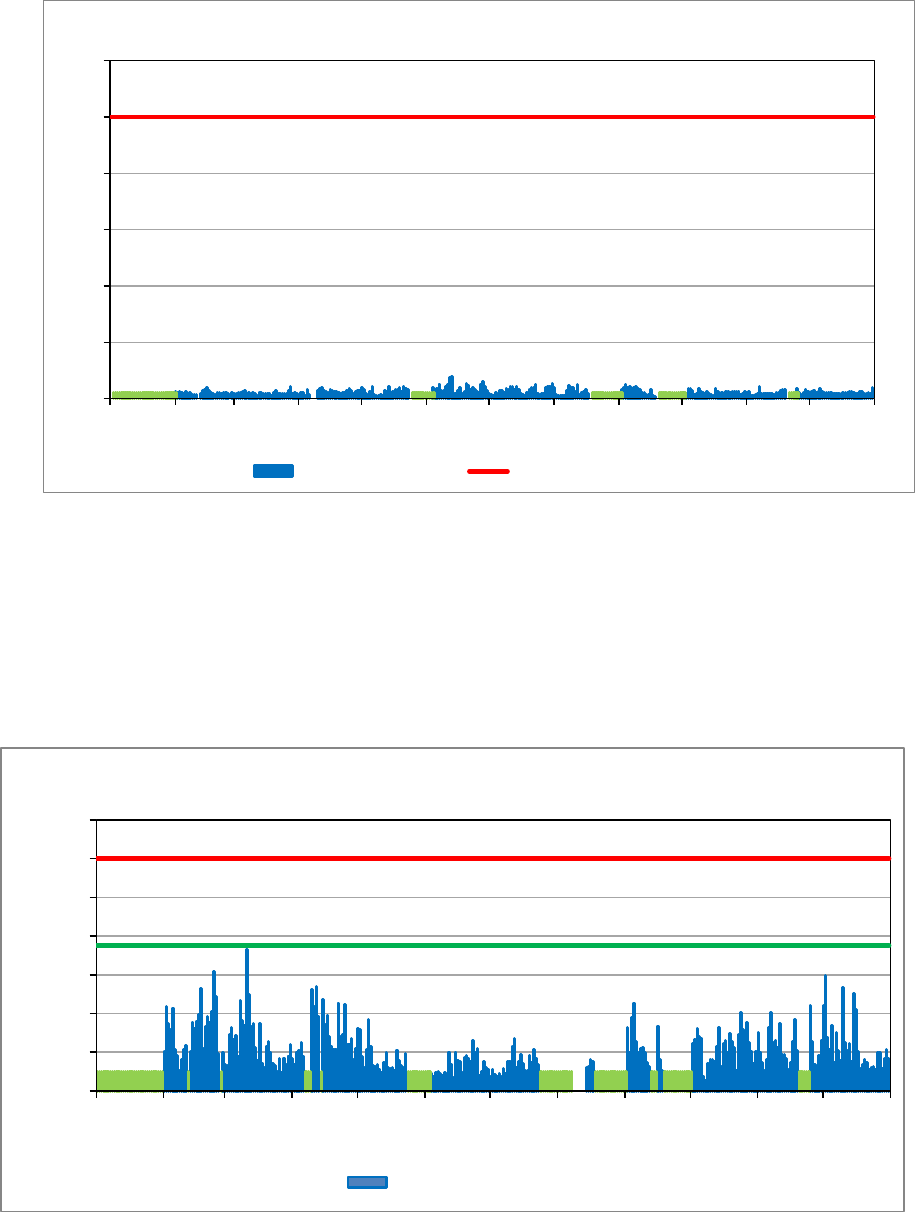
STATE OF AIR QUALITY MANAGEMENT: WESTERN CAPE 2014
33
Figure 1-22: Daily Maximum CO (8 – hour) at Vissershok (2014)
1.1.3.2. Particulate Matter (PM
10
)
The PM
10
concentrations measured at Vissershok monitoring station are presented in Figure 1-23. The
highest PM
10
level recorded during this period was 73 µg/m³ on 11 March 2014. There were no
exceedances of the PM
10
(24 – hours) SA-AAQS of 120 µg/m³ or the proposed SA-AAQS of 75 µg/m³
(2015). The data gaps were as a result of instrument failure and power problems.
Figure 1-23: Daily Mean PM
10
concentrations (24 – hour) at Visssershok (2014)
1.1.3.3. Long term air quality data for Vissershok
The long term trend for CO shows a steady average of approximately 0.25 mg/m
3
(Figure 1-24). The
daily maximum (8-hr mean) concentrations measured for the period under review is well below the SA-
AAQS (CO daily maximum 8-hr mean) of 10 mg/m³.
0
2
4
6
8
10
12
Jan Feb Mar Apr May Jun Jul Aug Sep Oct Nov Dec
Concentration (mg/m
3
)
Period (months)
Daily Maximum 8-hr Mean Concentrations for CO at Vissershok
1 January - 31 December 2014
CO Concentration SA Ambient AQ Standard
0
20
40
60
80
100
120
140
Jan Feb Mar Apr May Jun Jul Aug Sep Oct Nov Dec
Concentration (µg/m
3
)
Period (months)
Daily Mean PM
10
Concentrations at Vissershok
1 January - 31 December 2014
PM₁₀ Concentration
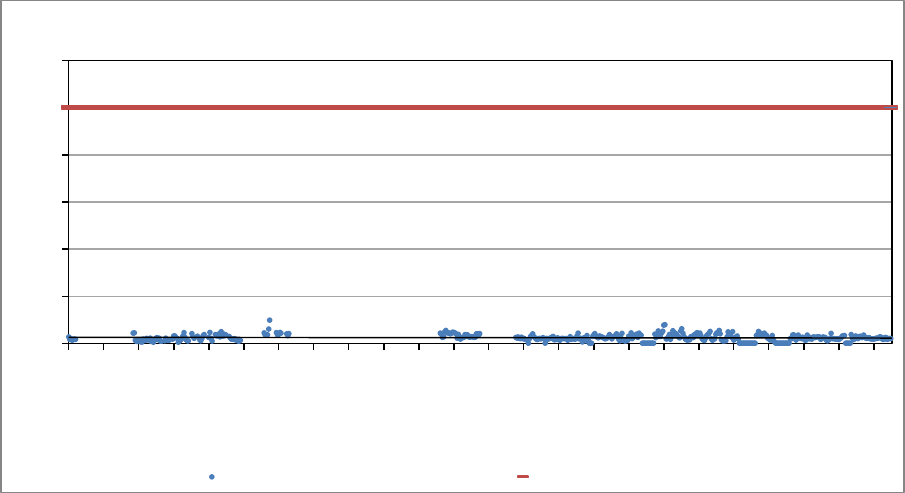
STATE OF AIR QUALITY MANAGEMENT: WESTERN CAPE 2014
34
The long term trend for O
3
at Vissershok shows a general declining trend (Figure 1-25). O
3
is a secondary
pollutant that is produced when Volatile Organic Compounds (VOCs) and NO
2
gases react with each
other in the presence of strong sunlight, which often results in O3 showing a seasonal cycle.
The long term trend for NO
2
shows a slight downward trend. The daily maximum concentrations
measured for the period under review (Figure 1-26) is well below the SA-AAQS (NO
2
1-hr mean) of 200
µg/m³.
The long term trend for PM
10
shows a slight downward trend. The daily maximum concentrations
measured for the period under review (Figure 1-27) is well below the SA-AAQS (PM
10
daily mean) of 120
µg/m³.
Figure 1-24: Long Term CO trend at Vissershok (Jan 2013 – Dec 2014)
0
2
4
6
8
10
12
Jan 2013
Feb 2013
Mar 2013
Apr 2013
May 2013
Jun 2013
Jul 2013
Aug 2013
Sep 2013
Oct 2013
Nov 2013
Dec 2013
Jan 2014
Feb 2014
Mar 2014
Apr 2014
May 2014
Jun 2014
Jul 2014
Aug 2014
Sep 2014
Oct 2014
Nov 2014
Dec 2014
Concentration (mg/m
3
)
Period (months)
Daily Maximum 8-hr Mean Concentrations for CO at Malmesbury
January 2013- December 2014
CO Concentration SA Ambient AQ Standard
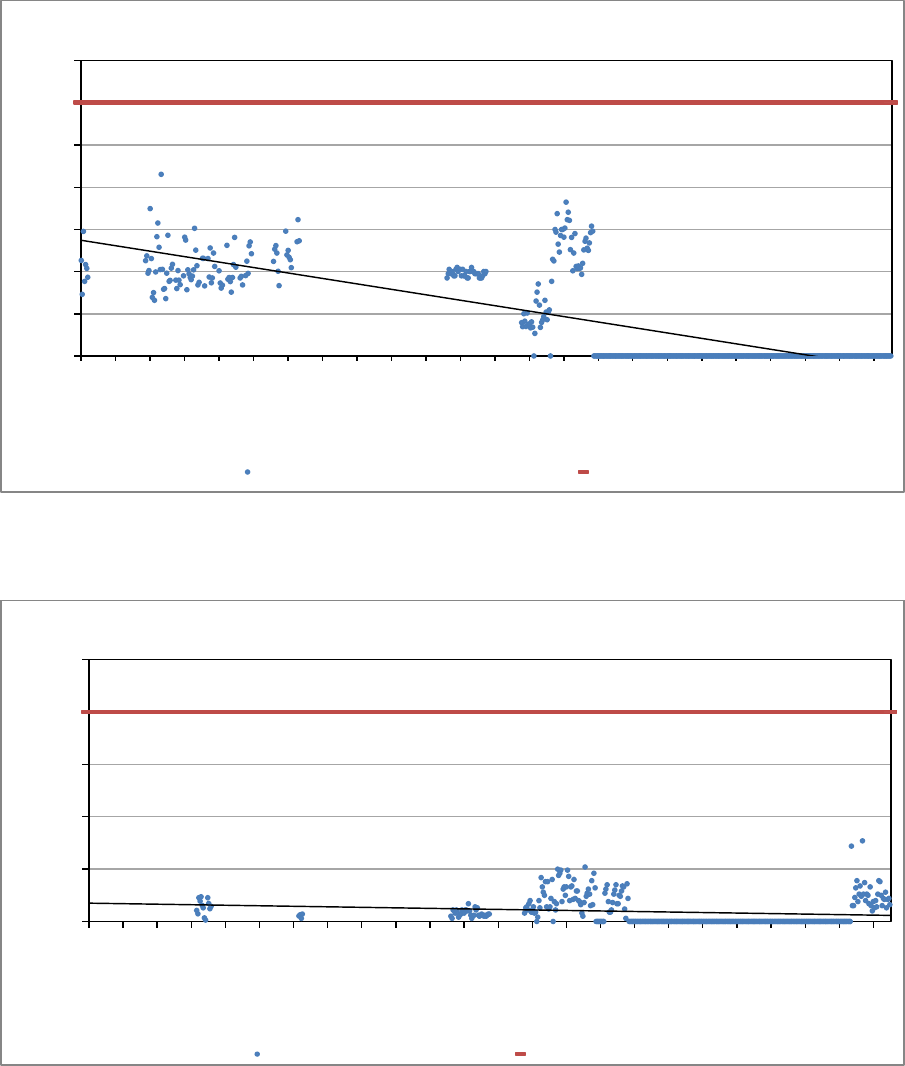
STATE OF AIR QUALITY MANAGEMENT: WESTERN CAPE 2014
35
Figure 1-25: Long Term O
3
trend at Vissershok (Jan 2013 – Dec 2014)
Figure 1-26: Long Term NO
2
trend at Vissershok (Jan 2013 – Dec 2014)
0
20
40
60
80
100
120
140
Jan 2013
Feb 2013
Mar 2013
Apr 2013
May 2013
Jun 2013
Jul 2013
Aug 2013
Sep 2013
Oct 2013
Nov 2013
Dec 2013
Jan 2014
Feb 2014
Mar 2014
Apr 2014
May 2014
Jun 2014
Jul 2014
Aug 2014
Sep 2014
Oct 2014
Nov 2014
Dec 2014
Concentration (µg/m
3
)
Period (months)
Daily Maximum 8-hr Mean Concentrations for O
3
at Vissershok
January 2013 - December 2014
O₃ Concentration
O3 Standards
0
50
100
150
200
250
Jan 2013
Feb 2013
Mar 2013
Apr 2013
May 2013
Jun 2013
Jul 2013
Aug 2013
Sep 2013
Oct 2013
Nov 2013
Dec 2013
Jan 2014
Feb 2014
Mar 2014
Apr 2014
May 2014
Jun 2014
Jul 2014
Aug 2014
Sep 2014
Oct 2014
Nov 2014
Dec 2014
Concentration (µg/m
3
)
Period (months)
Daily Maximum Hourly Mean for NO
2
at Vissershok
January 2013- December 2014
NO₂ concentration
SA Ambient AQ Standard
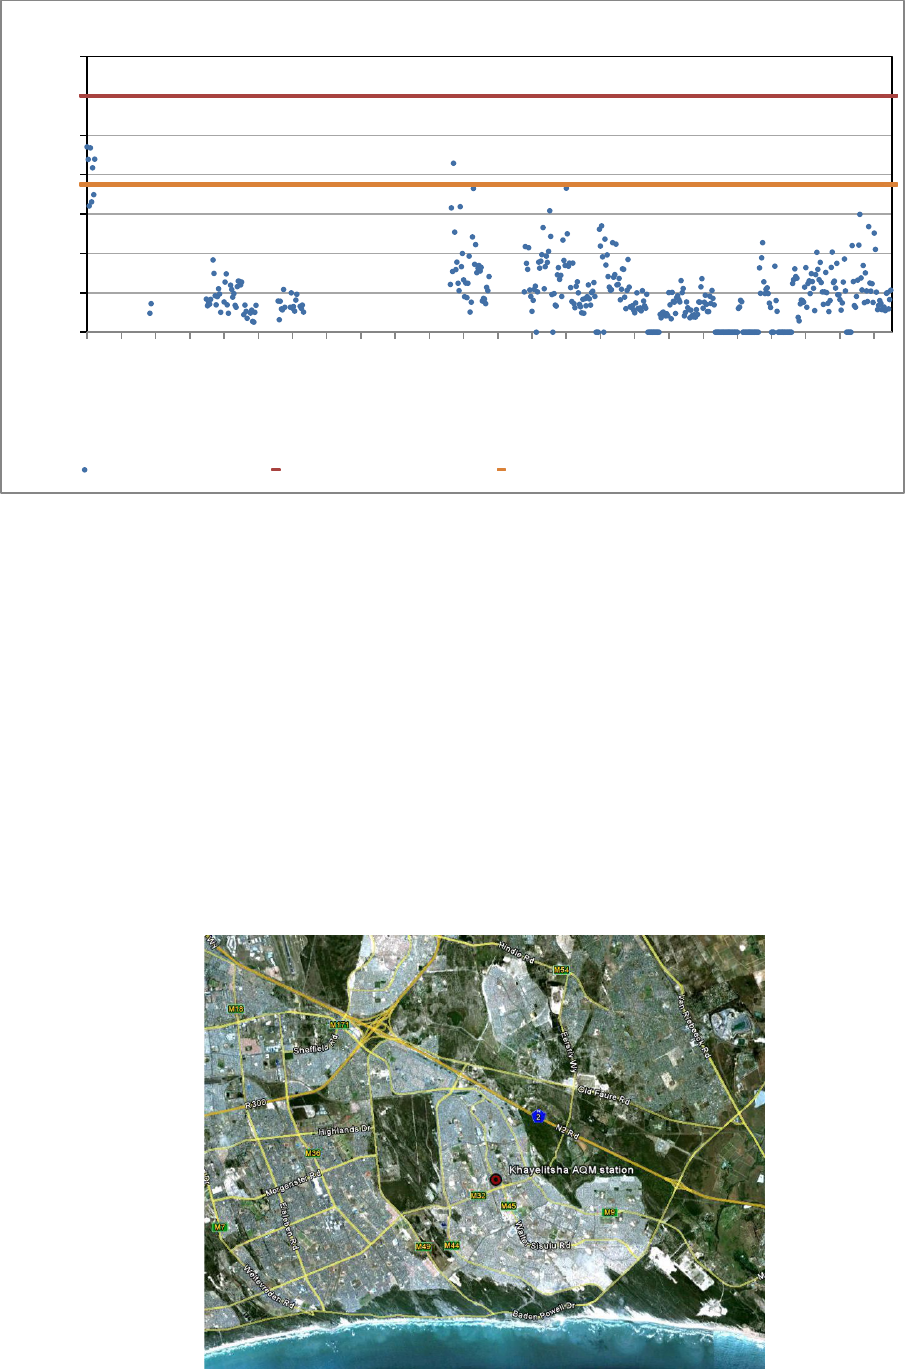
STATE OF AIR QUALITY MANAGEMENT: WESTERN CAPE 2014
36
Figure 1-27: Long Term PM
10
trend at Vissershok (Jan 2013 – Dec 2014)
1.1.4. Khayelitsha (City of Cape Town)
The Khayelitsha monitoring station was commissioned at a local training centre in Khayelitsha on 04
May 2011 and was operational at this location until August 2013. The monitoring station’s site co-
ordinates were 34° 02’ 17.27”S and 18° 40’ 10.78”E and it was equipped to continuously monitor SO
2
,
NO
2
, PM
10
, O
3
, CO and CO
2
. Khayelitsha is an informal settlement situated south-east of Cape Town
(Figure 1-28). The monitoring station was decommissioned during August 2013, as the site was
earmarked for development by the City of Cape Town. After an extensive site selection process, a new
location (Khayelitsha District Hospital), less than five kilometres from the old site, was identified and the
site preparation and station relocation was completed during December 2014. Due to the station
relocation taking place during December 2014, data is not reported for the 2014 year.
Figure 1-28: An aerial photo of the monitoring station at Khayelitsha
0
20
40
60
80
100
120
140
Jan 2013
Feb 2013
Mar 2013
Apr 2013
May 2013
Jun 2013
Jul 2013
Aug 2013
Sep 2013
Oct 2013
Nov 2013
Dec 2013
Jan 2014
Feb 2014
Mar 2014
Apr 2014
May 2014
Jun 2014
Jul 2014
Aug 2014
Sep 2014
Oct 2014
Nov 2014
Dec 2014
Concentration (µg/m
3
)
Period (months)
Daily Mean PM
10
Concentrations at Vissershok
January 2013- December 2014
PM₁₀ Concentration SA Ambient AQ Standard Proposed SA Ambient Air Quality Standard for 2015
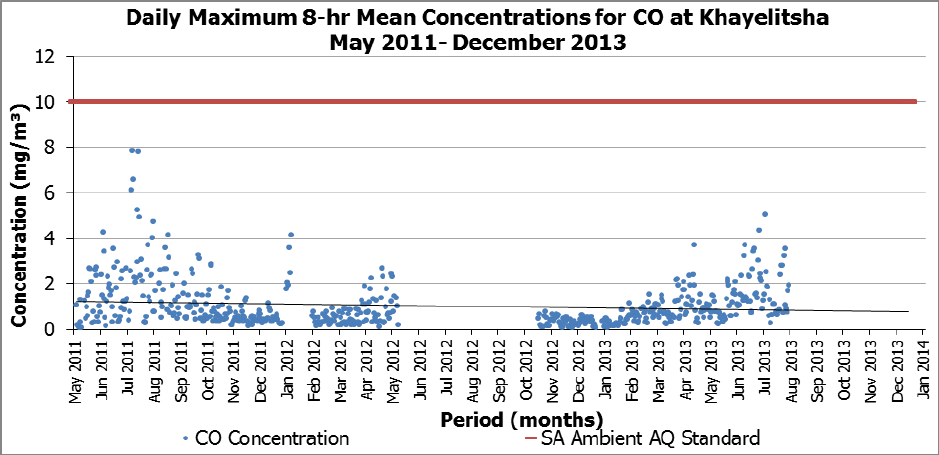
STATE OF AIR QUALITY MANAGEMENT: WESTERN CAPE 2014
37
1.1.4.1. Long term air quality trends for Khayelitsha
The long term trends for the parameters measured at Khayelitsha, up to August 2013, are shown in
Figure 1-30 to Figure 1-29. Overall, all parameters measured are below the SA-AAQS.
The long term trend for CO is steady at approximately 1 mg/m
3
(Figure 1-29). The daily maximum (8-hr
mean) concentrations measured for the period under review is well below the SA-AAQS (CO daily
maximum 8-hr mean) of 10mg/m³.
The long term data for O
3
at Khayelitsha shows a downward trend from approximately 45 µg/m³ to 20
µg/m³ (Figure 1-30). O
3
is a secondary pollutant that is produced when VOC and NO
2
gases react with
each other in the presence of sunlight.
The long term trend for NO
2
shows a slight downward trend. The daily maximum concentrations
measured for the period under review (Figure 1-31) is well below the SA-AAQS (NO
2
1-hr mean) of 200
µg/m³.
The long term trend for SO
2
is steady at approximately 4 µg/m
3
(Figure 1-32). The daily mean
concentrations measured for the period under review is well below the SA-AAQS (SO
2
daily mean) of
125 µg/m³.
Figure 1-29: Trend of Daily (until Aug 2013) Maximum 8-hr Mean CO
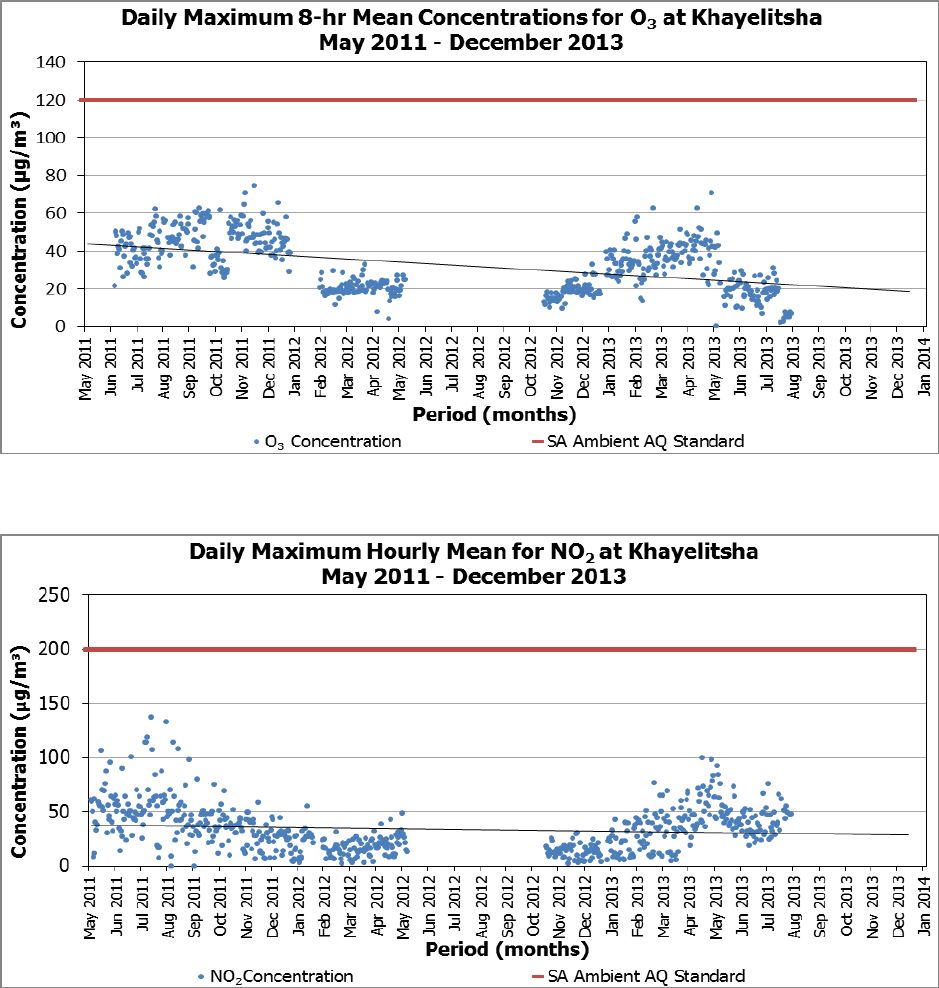
STATE OF AIR QUALITY MANAGEMENT: WESTERN CAPE 2014
38
Figure 1-30: Trend of Daily (until Aug 2013) Maximum 8-hr Mean O
3
Figure 1-31: Trend of Daily (until Aug 2013) Maximum Hourly Mean NO
2
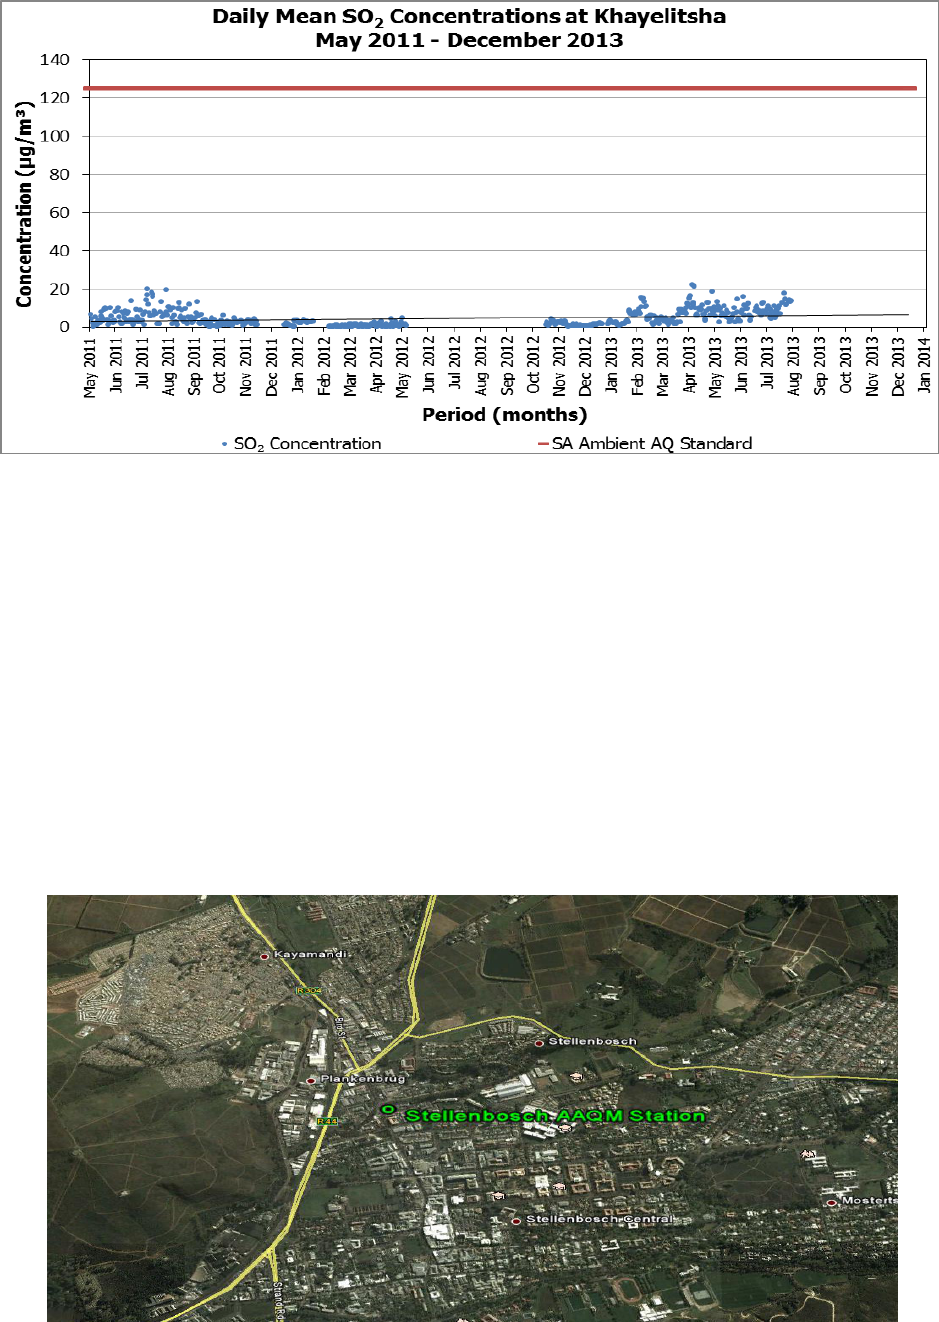
STATE OF AIR QUALITY MANAGEMENT: WESTERN CAPE 2014
39
Figure 1-32: Trend of Daily (until Aug 2013) Mean SO
2
1.1.5. Stellenbosch (Cape Winelands District Municipality)
The Stellenbosch monitoring station is located at the Cape Winelands District Municipality (CWDM)
offices on the corner of Bird and Langenhoven Streets in Stellenbosch, at 18° 51’ 25.94” East and 33°
55’ 39.50” South (Figure 1-33). The station was commissioned in August 2011. Although located close
to residential areas, the station is impacted by vehicle emissions due to it being located next to a
major traffic gateway into and out of Stellenbosch. No exceedances were recorded for the
parameters measured at Stellenbosch. The percentage (%) data recovery is low, as a result of
electrical and air conditioner problems at the station (Table 1-5). As the data recovery for CO
2
and
SO
2
was <60%, these parameters are not reported for 2014; long term trends are, however, presented
in Figure 1-37 to Figure 1-38. CO and PM
10
are, however, reported for 2014 (Figure 1-34 to Figure 1-35).
Figure 1-33: An aerial photo of the monitoring station at Stellenbosch
Table 1-5: Stellenbosch Data Capture after quality control (2014)
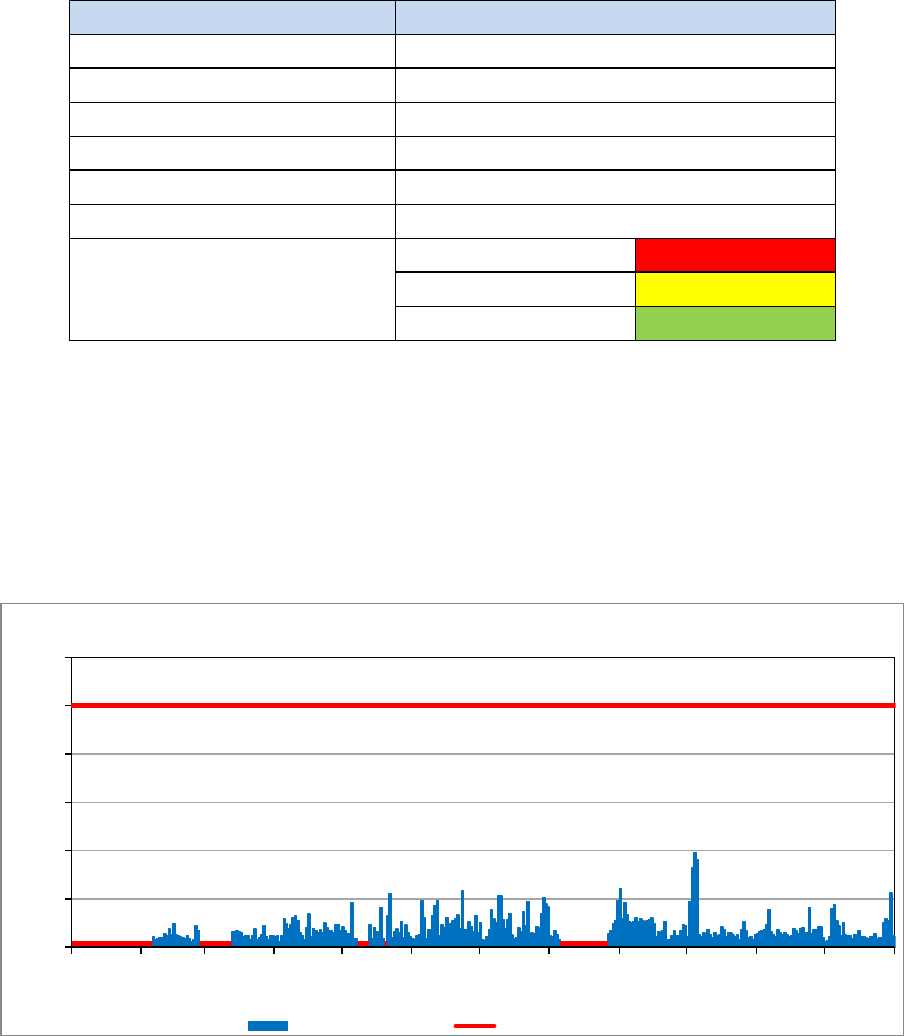
STATE OF AIR QUALITY MANAGEMENT: WESTERN CAPE 2014
40
1.1.5.1. Carbon Monoxide (CO)
The CO concentrations measured at the Stellenbosch monitoring station are presented in Figure 1-34.
Overall, the CO levels remained well below the SA-AAQS of 10 mg/m³ during 1 January to 31
December 2014. The CO (8 – hour) SA-AAQS of 10 mg/m³ (RSA, 2009) was not exceeded during the
monitoring period.
Figure 1-34: Daily Maximum CO (8 – hour Mean) at Stellenbosch (2014)
1.1.5.2. Ozone (O
3
)
The O
3
concentrations measured at Stellenbosch are presented in Figure 1-35. The O
3
(8 – hour, running
average) SA-AAQS of 120µg/m³ was not exceeded during this period. The data gaps are due to a
combination of analyser, electricity and air conditioner problems.
Jan Feb Mar Apr May Jun Jul Aug
Sep
Oct Nov Dec
0
2
4
6
8
10
12
Concentration (mg/m
3
)
Period (months)
Daily Maximum CO Concentrations (8-hr mean) at Stellenbosch
1 January - December 2014
CO Concentration SA Ambient AQ Standard
Measurement
% Data Capture
Carbon Monoxide (CO)
79
Ozone (O
3
)
<60
Nitrogen Dioxide (NO
2
)
<60
Sulphur Dioxide (SO
2
)
<60
Particulates (PM
10
)
63
Carbon Dioxide (CO
2
)
<60
Legend description on graphs
Power Failure
Data Capture Failure
Instrument Failure
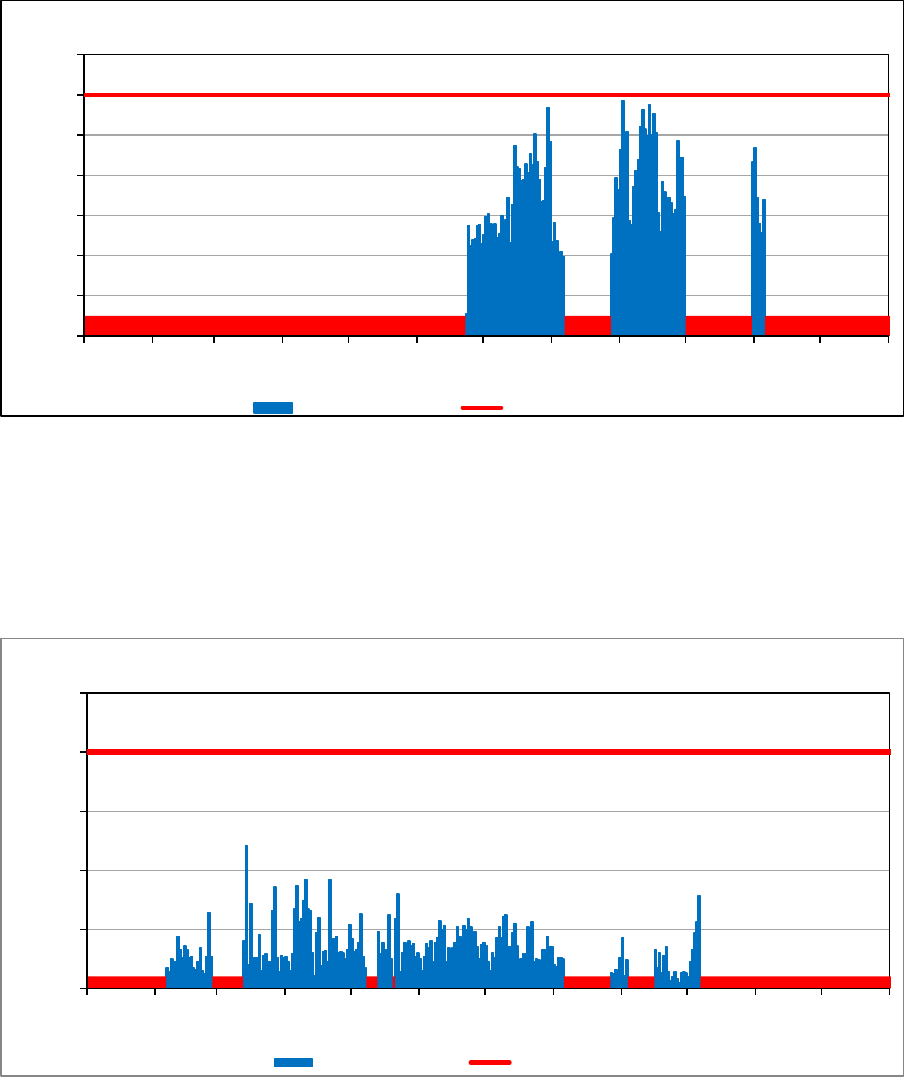
STATE OF AIR QUALITY MANAGEMENT: WESTERN CAPE 2014
41
Figure 1-35: Daily Maximum O
3
concentration (8 – hour Mean) at Stellenbosch (2014)
1.1.5.3. Nitrogen Dioxide (NO
2
)
The NO
2
concentrations measured at the Stellenbosch monitoring station are presented in Figure 1-36.
The NO
2
(1 - hour) SA-AAQS of 200 µg/m³ was not exceeded.
Figure 1-36: Daily Maximum NO
2
concentration (1 – hour Mean) at Stellenbosch (2014)
1.1.5.4. Particulate Matter (PM
10
)
The PM
10
concentrations measured at Stellenbosch are presented in Figure 1-37. There were no
exceedances of the PM
10
(24 – hours) SA-AAQS of 120 µg/m³ or the proposed SA-AAQS of 75 µg/m³
(2015). The data gaps for PM
10
record during 2014 was as a result of power supply, air conditioner and
analyser problems.
Jan Feb Mar Apr May Jun Jul Aug Sep Oct Nov Dec
0
20
40
60
80
100
120
140
Concentration ( µg/m
3
)
Period (months)
Daily Maximum O
3
Concentrations (8 -hour) at Stellenbosch
1 January - December 2014
O₃ Concentration
SA Ambient AQ Standard
Jan Feb Mar Apr May Jun Jul Aug Sep Oct Nov Dec
0
50
100
150
200
250
Concentration (µg/m
3
)
Period (months)
Daily Maximum Hourly Mean for NO
2
at Stellenbosch
1 January - December 2014
NO₂ Concentration
SA Ambient AQ Standard
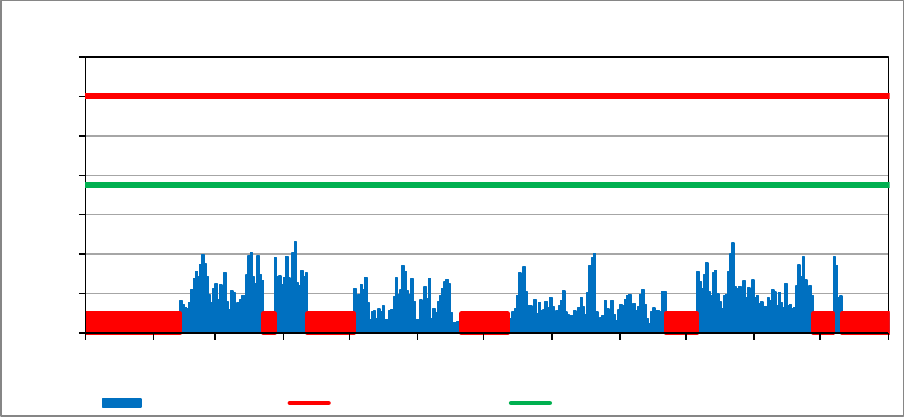
STATE OF AIR QUALITY MANAGEMENT: WESTERN CAPE 2014
42
Figure 1-37: Daily Mean PM
10
concentrations (24 – hour) at Stellenbosch (2014)
1.1.5.5. Long Term Air Quality Trend for Stellenbosch
The long term CO trend of less than 1 mg/m
3
remains well below the 10 mg/m
3
SA-AAQS standard. As
with NO
2
there appears to be a seasonal cycle, with lower values in the December-January period,
and higher in the June-July period (Figure 1-38). These are most likely due to stronger and more
consistent summer southerly winds. Overall, the parameters measured were below the SA-AAQS, as
shown in Figure 1-37 to Figure 1-38.
The long term O
3
concentration (Figure 1-39) appears to be increasing from 40 µg/m³ to 80 µg/m³.
However, the data gap in early 2014 may be the cause of this apparent long term increase, compared
to the trend from mid- 2012 appears to be steady at 42 µg/m³.
The long term NO
2
trend remained steady at around 35 µg/m³ for the period (Figure 1-40). There
appears to be a seasonal cycle, with elevated concentrations measured in the December-January
period, and peaks in winter.
The long term PM
10
concentration remained steady at about 20 µg/m³ for the period (Figure 1-41).
Although no discernable seasonal cycle is visible, the highest PM
10
values were recorded during June to
July, in 2012 and 2014.
Jan Feb Mar Apr May Jun Jul Aug Sep Oct Nov Dec
0
20
40
60
80
100
120
140
Concentration (µg/m
3
)
Period (months)
Daily Mean PM
10
Concentrations at Stellenbosch
1 January - 31 December 2014
PM₁₀ Concentration
SA Ambient AQ Standard Proposed SA Ambient Air Quality Standard for 2015
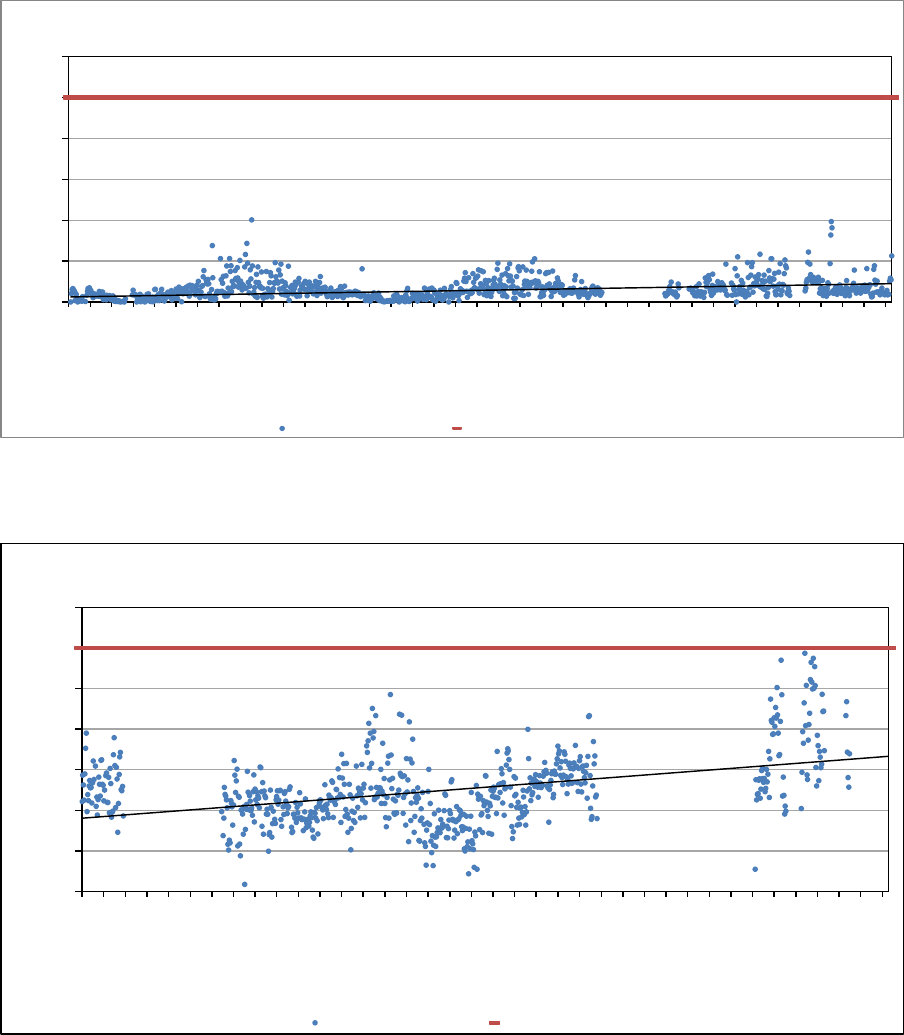
STATE OF AIR QUALITY MANAGEMENT: WESTERN CAPE 2014
43
Figure 1-38: Long Term CO trend at Stellenbosch (Oct 2011 – Dec 2014)
Figure 1-39: Long Term O
3
trend at Stellenbosch (Nov 2011 – Dec 2014)
0
2
4
6
8
10
12
Oct 2011
Nov 2011
Dec 2011
Jan 2012
Feb 2012
Mar 2012
Apr 2012
May 2012
Jun 2012
Jul 2012
Aug 2012
Sep 2012
Oct 2012
Nov 2012
Dec 2012
Jan 2013
Feb 2013
Mar 2013
Apr 2013
May 2013
Jun 2013
Jul 2013
Aug 2013
Sep 2013
Oct 2013
Nov 2013
Dec 2013
Jan 2014
Feb 2014
Mar 2014
Apr 2014
May 2014
Jun 2014
Jul 2014
Aug 2014
Sep 2014
Oct 2014
Nov 2014
Dec 2014
Concentration (mg/m
3
)
Period (months)
Daily Maximum CO Concentrations (8-hr mean) at Stellenbosch
October 2011-December 2014
CO Concentration SA Ambient AQ Standard
0
20
40
60
80
100
120
140
Nov 2011
Dec 2011
Jan 2012
Feb 2012
Mar 2012
Apr 2012
May 2012
Jun 2012
Jul 2012
Aug 2012
Sep 2012
Oct 2012
Nov 2012
Dec 2012
Jan 2013
Feb 2013
Mar 2013
Apr 2013
May 2013
Jun 2013
Jul 2013
Aug 2013
Sep 2013
Oct 2013
Nov 2013
Dec 2013
Jan 2014
Feb 2014
Mar 2014
Apr 2014
May 2014
Jun 2014
Jul 2014
Aug 2014
Sep 2014
Oct 2014
Nov 2014
Dec 2014
Concentration ( µg/m
3
)
Period (months)
Daily Maximum O
3
Concentrations (8 -hour) at Stellenbosch
November 2011 - December 2014
O₃ Concentration
SA Ambient AQ Standard
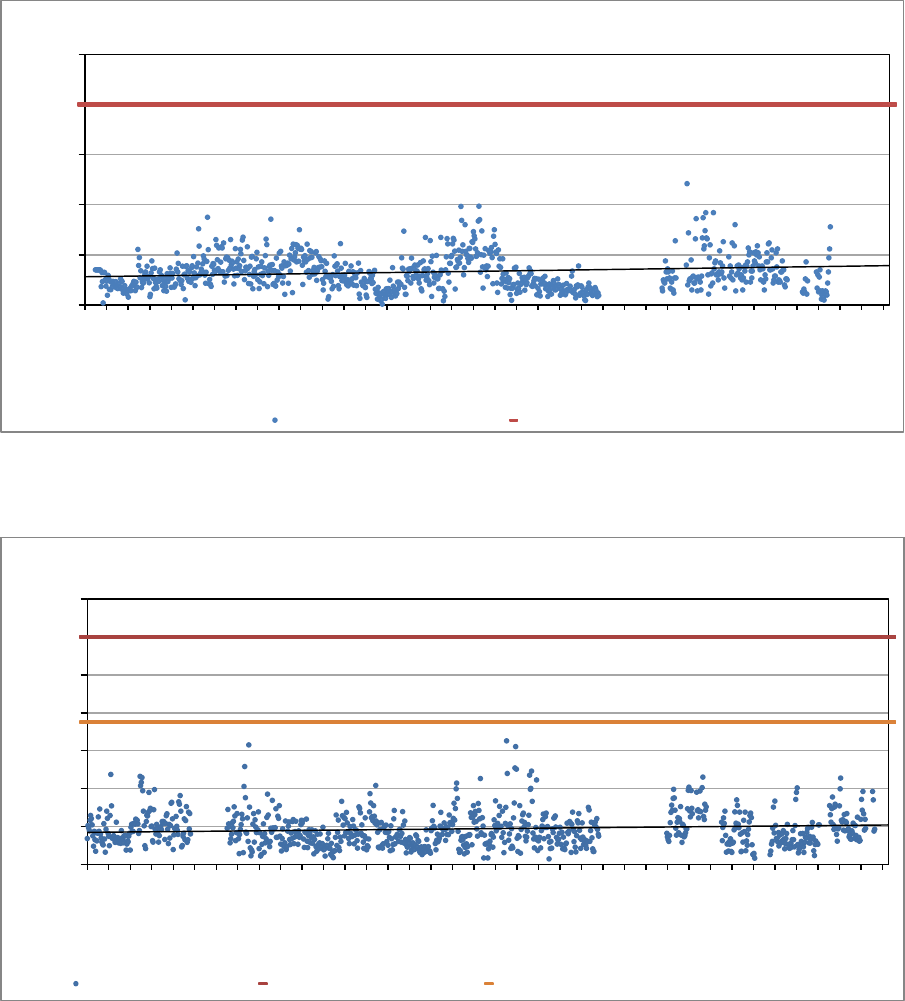
STATE OF AIR QUALITY MANAGEMENT: WESTERN CAPE 2014
44
Figure 1-40: Long Term NO
2
trend at Stellenbosch (Nov 2011 – Dec 2014)
Figure 1-41: Long Term PM
10
trend at Stellenbosch (Nov 2011 – Dec 2014)
1.1.6. Worcester (Cape Winelands District Municipality)
The Worcester monitoring station was commissioned at the Meirings Park Electric Sub-station during
August 2009, and is located at 19° 28’ 54.2” East and 33° 37’ 39.26” South (Figure 1-42). The monitoring
station is located in a residential area, downwind from industry and is adjacent to the N1 National
Road. Data recovery for all parameters measured during 2014 were less than 60%, as a result of
instrument failure and power problems (Table 1-6) and are thus not reported. Due to continuous
electrical problems experienced at the Worcester station, a new power supply cable was installed to
address the problem. Long term trends in air quality parameters, except for NO
2
and SO
2
measured at
Worcester, are presented in Figure 1-44 to Figure 1-45.
0
50
100
150
200
250
Nov 2011
Dec 2011
Jan 2012
Feb 2012
Mar 2012
Apr 2012
May 2012
Jun 2012
Jul 2012
Aug 2012
Sep 2012
Oct 2012
Nov 2012
Dec 2012
Jan 2013
Feb 2013
Mar 2013
Apr 2013
May 2013
Jun 2013
Jul 2013
Aug 2013
Sep 2013
Oct 2013
Nov 2013
Dec 2013
Jan 2014
Feb 2014
Mar 2014
Apr 2014
May 2014
Jun 2014
Jul 2014
Aug 2014
Sep 2014
Oct 2014
Nov 2014
Dec 2014
Concentration (µg/m
3
)
Period (months)
Daily Maximum Hourly Mean for NO
2
at Stellenbosch
November 2011 - December 2014
NO₂ Concentration
SA Ambient AQ Standard
0
20
40
60
80
100
120
140
Nov 2011
Dec 2011
Jan 2012
Feb 2012
Mar 2012
Apr 2012
May 2012
Jun 2012
Jul 2012
Aug 2012
Sep 2012
Oct 2012
Nov 2012
Dec 2012
Jan 2013
Feb 2013
Mar 2013
Apr 2013
May 2013
Jun 2013
Jul 2013
Aug 2013
Sep 2013
Oct 2013
Nov 2013
Dec 2013
Jan 2014
Feb 2014
Mar 2014
Apr 2014
May 2014
Jun 2014
Jul 2014
Aug 2014
Sep 2014
Oct 2014
Nov 2014
Dec 2014
Concentration (µg/m
3
)
Period (months)
Daily Mean PM
10
Concentrations at Stellenbosch
November 2011 - December 2014
PM₁₀ Concentration
SA Ambient AQ Standard Proposed SA Ambient Air Quality Standard for 2015
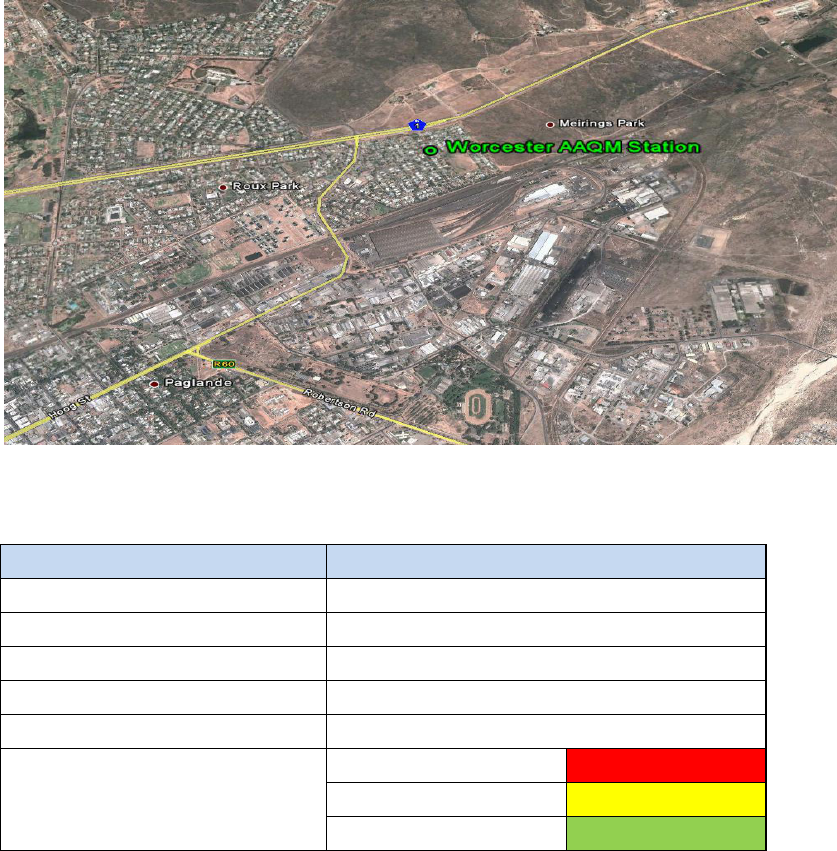
STATE OF AIR QUALITY MANAGEMENT: WESTERN CAPE 2014
45
Figure 1-42: Aerial image of the Worcester Ambient Air Quality Monitoring location
Table 1-6: Worcester Data Capture after quality control (2014)
Measurement
% Data Capture
Carbon Monoxide (CO)
< 60
Ozone (O
3
)
< 60
Nitrogen Dioxide (NO
2
)
< 60
Sulphur Dioxide (SO
2
)
< 60
Particulates (PM
10
)
< 60
Legend description on graphs
Power Failure
Data Capture Failure
Instrument Failure
1.1.6.1. Long Term Air Quality Data for Worcester
Overall, air quality parameters monitored in Worcester were below the SA-AAQS as shown in Figure 1-44
to Figure 1-45.
The long term CO concentration Figure 1-43 at Worcester (July 2009 – December 2014). The long term
O
3
concentration (Figure 1-44) shows a steady decline from approximately 60 µg/m³ to 40 µg/m³. The
long term PM
10
concentration (Figure 1-45) at Worcester (July 2009 – December 2014).
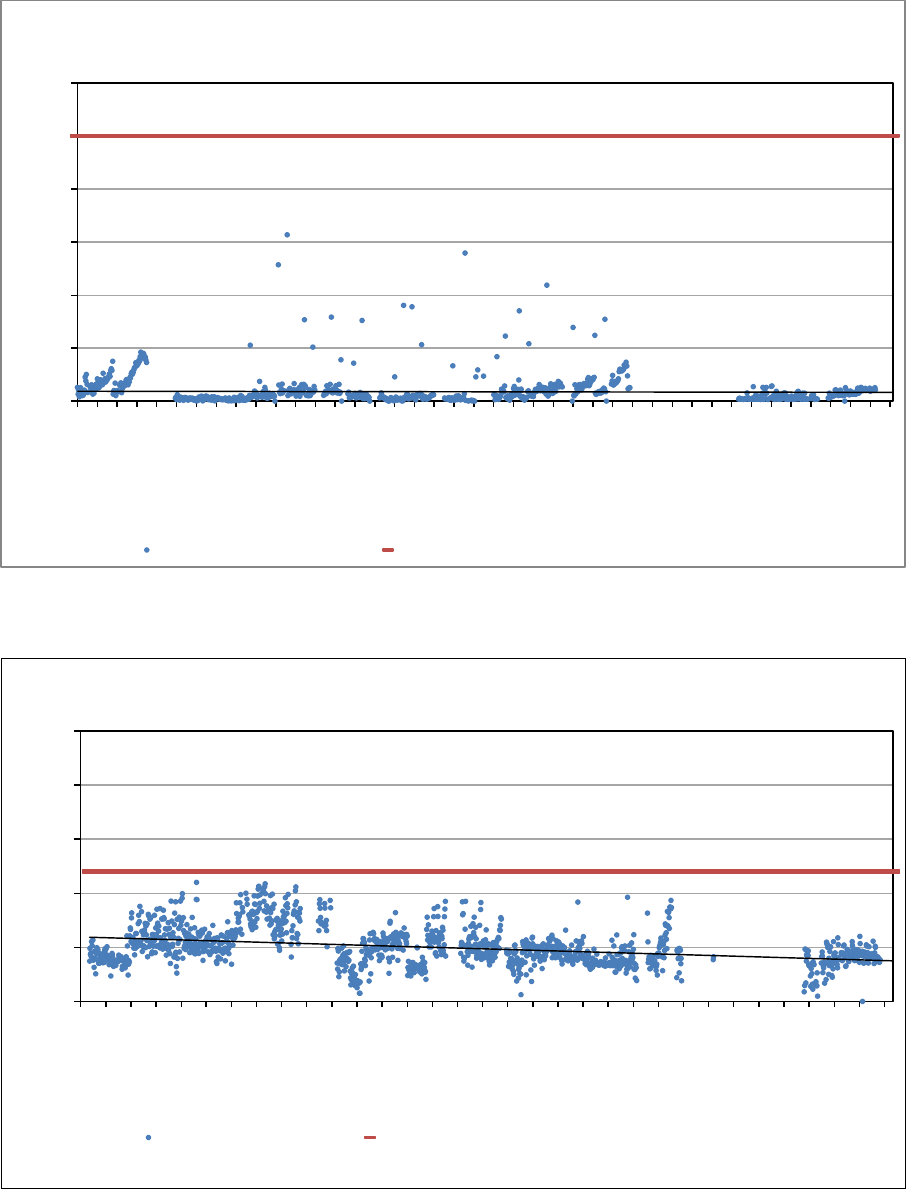
STATE OF AIR QUALITY MANAGEMENT: WESTERN CAPE 2014
46
Figure 1-43: Long Term CO trend at Worcester (July 2011 – Dec 2014)
Figure 1-45: Long Term PM10 trend at Worcester (July 2009 – Dec 2014)
Figure 1-44: Long Term O
3
trend at Worcester (July 2009 – Dec 2014)
0
2
4
6
8
10
12
Jul 2011
Aug 2011
Sep 2011
Oct 2011
Nov 2011
Dec 2011
Jan 2012
Feb 2012
Mar 2012
Apr 2012
May 2012
Jun 2012
Jul 2012
Aug 2012
Sep 2012
Oct 2012
Nov 2012
Dec 2012
Jan 2013
Feb 2013
Mar 2013
Apr 2013
May 2013
Jun 2013
Jul 2013
Aug 2013
Sep 2013
Oct 2013
Nov 2013
Dec 2013
Jan 2014
Feb 2014
Mar 2014
Apr 2014
May 2014
Jun 2014
Jul 2014
Aug 2014
Sep 2014
Oct 2014
Nov 2014
Dec 2014
Concentration (mg/m
3
)
Period (months)
Daily Maximum 8-hr Mean Concentrations for CO at Worcester
July 2011 - December 2014
Concentration (mg/m3) SA Ambient AQ Standard (mg/m3) (8hr running mean)
0
50
100
150
200
250
Jul 2009
Sep 2009
Nov 2009
Jan 2010
Mar 2010
May 2010
Jul 2010
Sep 2010
Nov 2010
Jan 2011
Mar 2011
May 2011
Jul 2011
Sep 2011
Nov 2011
Jan 2012
Mar 2012
May 2012
Jul 2012
Sep 2012
Nov 2012
Jan 2013
Mar 2013
May 2013
Jul 2013
Sep 2013
Nov 2013
Jan 2014
Apr 2014
Jun 2014
Aug 2014
Oct 2014
Dec 2014
Concentration (µg/m
3
)
Period (months)
Daily Maximum 8-hr Mean O
3
Concentrations at Worcester
July 2009 to December 2014
Concentration µg/m3 SA Ambient AQ Standard ( µg/m3) (8hr running mean)
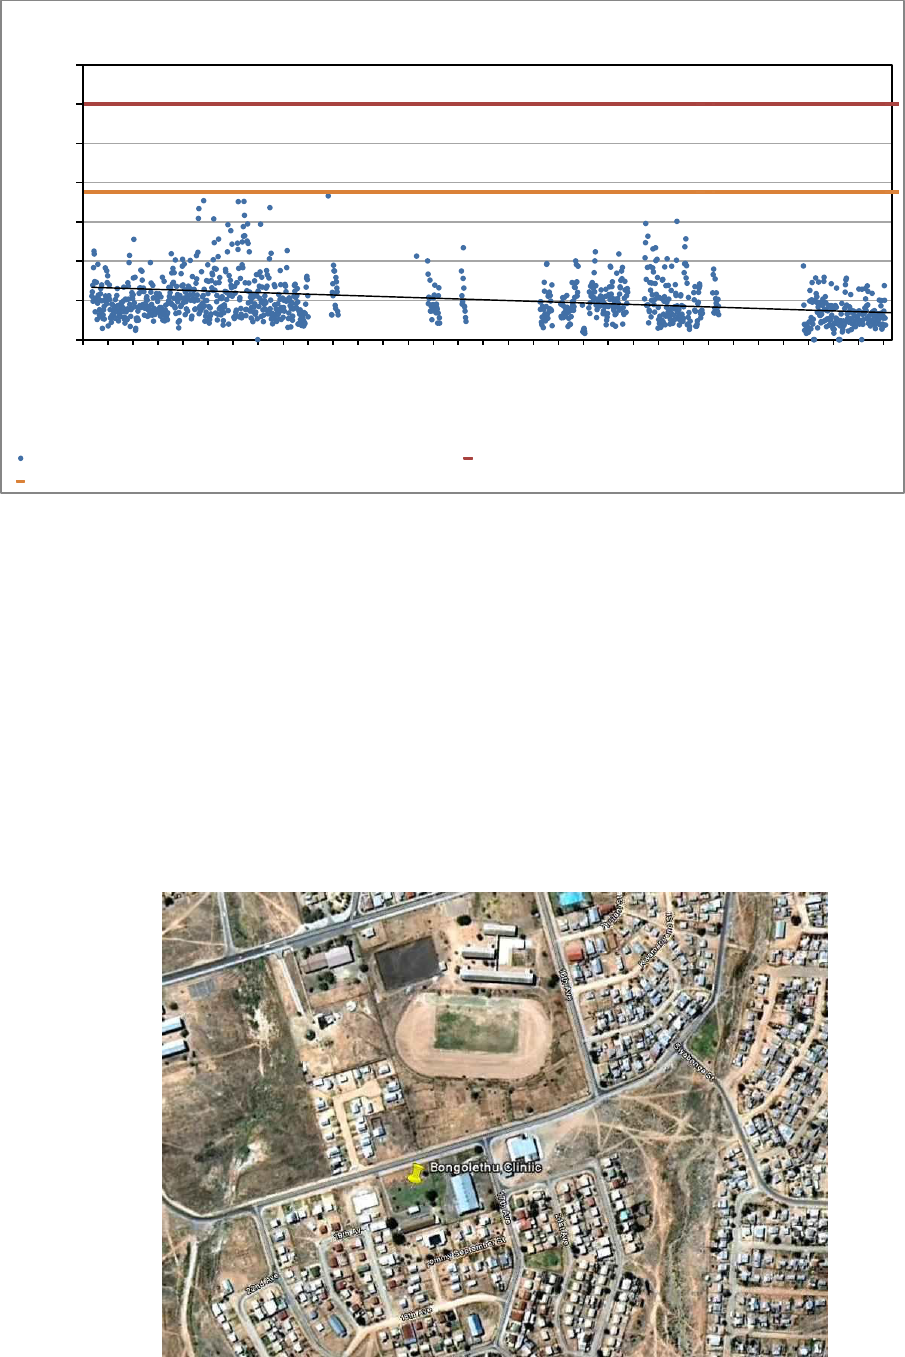
STATE OF AIR QUALITY MANAGEMENT: WESTERN CAPE 2014
47
Figure 1-45: Long Term PM
10
trend at Worcester (July 2009 – Dec 2014)
1.1.7. Oudtshoorn (Eden District, Oudtshoorn Municipality)
The Oudtshoorn monitoring station was commissioned at Bongolethu Clinic on April 2011 and is located
in a residential area, within closed proximity of an abattoir, tannery and municipal sewerage treatment
facility. The site coordinates are 33° 36’ 22.56’’ S and 22° 14’ 17.80’’ E (Figure 1-46). Table 1-7 shows the
data recovery for air quality parameters measured during 2014.
There are no specific SA-AAQS for H
2
S and CO
2
. However, the WHO suggests an H
2
S 24 hour average
health threshold of 150 µg/m
3
, as published in the WHO Air Quality Guidelines for Europe – 2
nd
Edition
(2000).
Figure 1-46: Aerial image of the Oudtshoorn Ambient Air Quality Monitoring site
0
20
40
60
80
100
120
140
Jul 2009
Sep 2009
Nov 2009
Jan 2010
Mar 2010
May 2010
Jul 2010
Sep 2010
Nov 2010
Jan 2011
Mar 2011
May 2011
Jul 2011
Sep 2011
Nov 2011
Jan 2012
Mar 2012
May 2012
Jul 2012
Sep 2012
Nov 2012
Jan 2013
Mar 2013
May 2013
Jul 2013
Sep 2013
Nov 2013
Jan 2014
Apr 2014
Jun 2014
Aug 2014
Oct 2014
Dec 2014
Concentration (µg/m
3
)
Period (months)
Daily Mean PM
10
Concentrations at Worcester
July 2009 - December 2014
Concentration (µg/m3) SA Ambient AQ Standard (µg/m3) (daily average)
Proposed SA Ambient Air Quality Standard for 2015 (µg/m3)
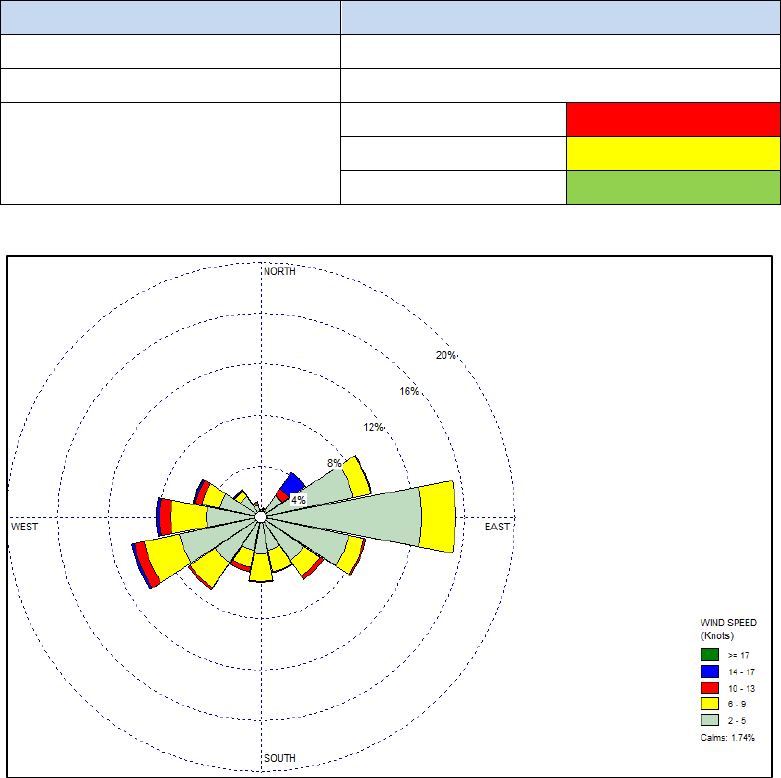
STATE OF AIR QUALITY MANAGEMENT: WESTERN CAPE 2014
48
Overall, the meteorological conditions for the period under review were characterized by variable light
to moderate winds, with strong westerly and east to south-easterly components and a 9.7% occurrence
of calm conditions (Figure 1-47).
Table 1-7: Oudtshoorn Data Capture after quality control (2014)
Measurement
% Data Capture
Hydrogen Sulphide (H
2
S)
63
Carbon Dioxide (CO
2
)
<60
Legend description on graphs
Power Failure
Data Capture Failure
Instrument Failure
Figure 1-47: Annual wind rose for Oudtshoorn (1 January 2013 – 31 December 2014)
1.1.7.1. Hydrogen Sulphide (H
2
S)
The H
2
S concentrations measured at the Oudtshoorn monitoring station are illustrated in Figure 1-48. H
2
S
levels measured were below 150 µg/m³ in terms of the WHO air quality guideline for health impact
evaluation. The H
2
S peaks can likely be attributed to industrial operations in the area.
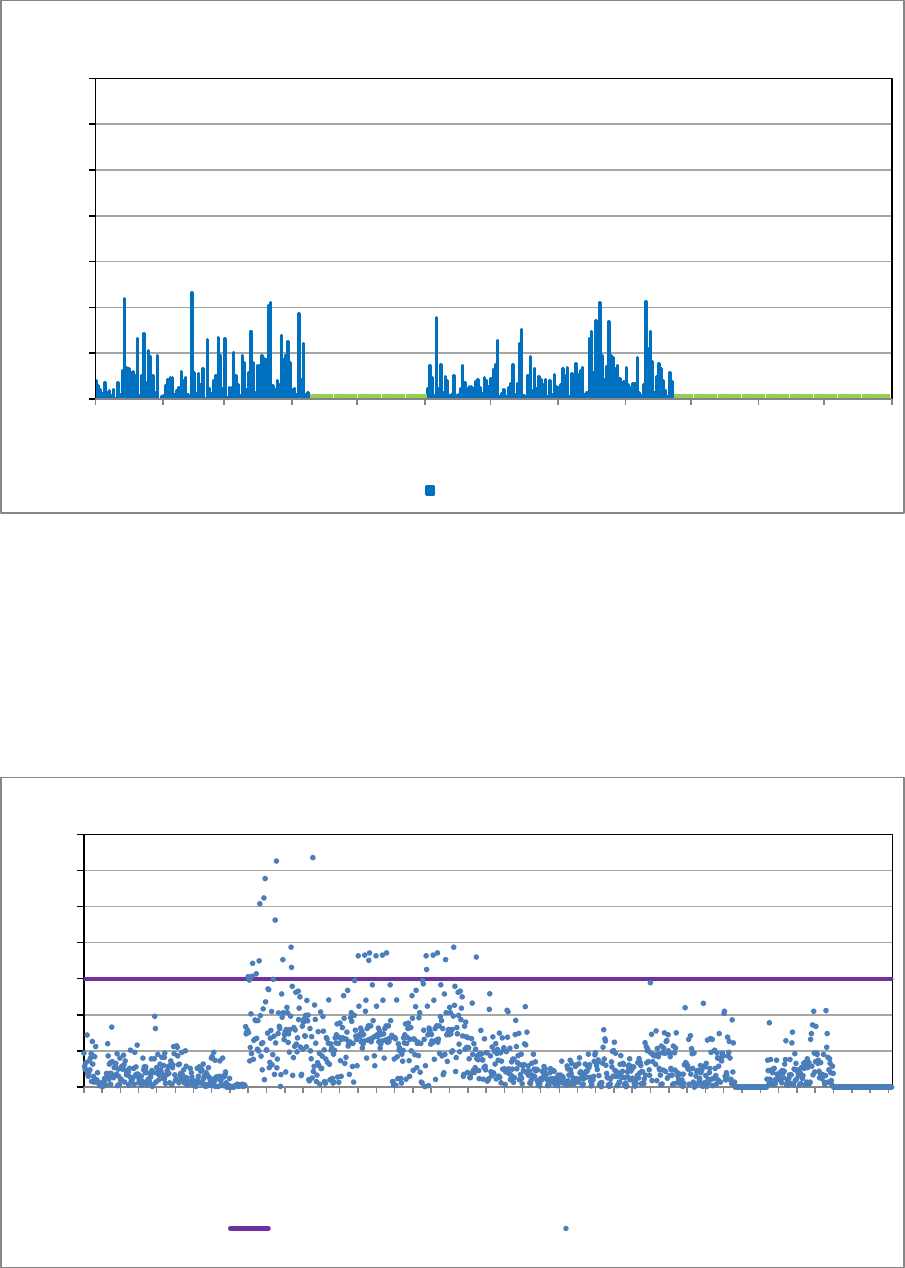
STATE OF AIR QUALITY MANAGEMENT: WESTERN CAPE 2014
49
Figure 1-48: Daily Maximum (30 – minute) for H
2
S at Oudtshoorn (2014)
1.1.7.2. Long term air quality trends for Oudtshoorn
The H
2
S concentrations measured at the Oudtshoorn monitoring station (Figure 1-49) shows steady
value of approximately 45 µg/m³.
The CO
2
concentrations measured at the Oudtshoorn monitoring station, illustrated in Figure 1-50 shows
steady values of approximately 420 ppm.
Figure 1-49: Long term H
2
S trend at Oudtshoorn (Oct 2011 – Dec 2014)
0
50
100
150
200
250
300
350
Jan Feb Mar Apr May Jun Jul Aug Sep Oct Nov Dec
Concentration (µg/m
3
)
Period (months)
Daily Maximum Hourly Mean for H
2
S at Oudtshoorn
1 January - 31 December 2014
H₂S concentration
0
50
100
150
200
250
300
350
Apr 2011
May 2011
Jun 2011
Jul 2011
Aug 2011
Sep 2011
Oct 2011
Nov 2011
Dec 2011
Jan 2012
Feb 2012
Mar 2012
Apr 2012
May 2012
Jun 2012
Jul 2012
Aug 2012
Sep 2012
Oct 2012
Nov 2012
Dec 2012
Jan 2013
Feb 2013
Mar 2013
Apr 2013
May 2013
Jun 2013
Jul 2013
Aug 2013
Sep 2013
Oct 2013
Nov 2013
Dec 2013
Jan 2014
Feb 2014
Mar 2014
Apr 2014
May 2014
Jun 2014
Jul 2014
Aug 2014
Sep 2014
Oct 2014
Nov 2014
Dec 2014
Concentration (µg/m
3
)
Period (months)
Daily Maximum Hourly Mean for H
2
S at Oudtshoon
April 2011- December 2014
WHO Guideline (150 µg/m³)
H₂S concentration
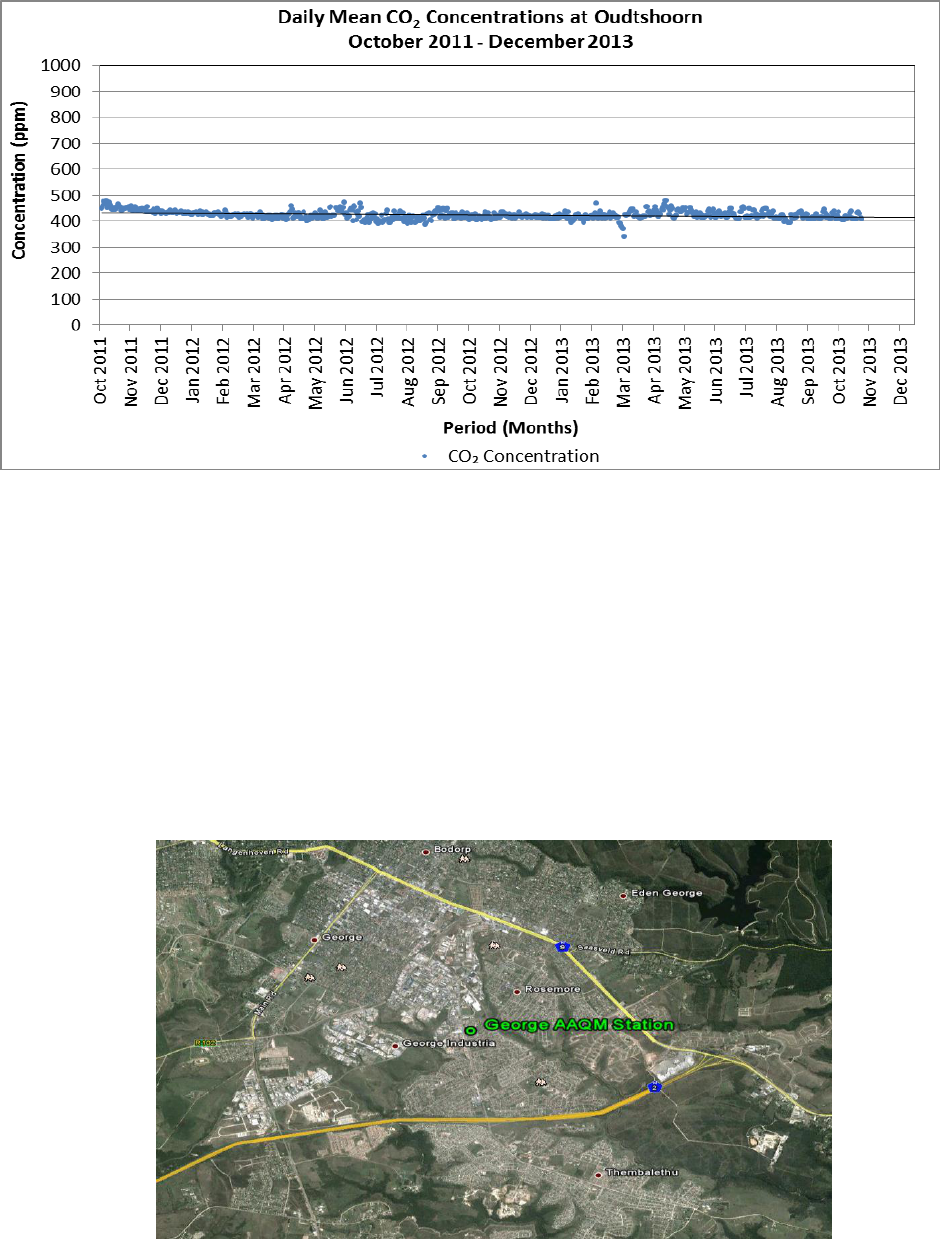
STATE OF AIR QUALITY MANAGEMENT: WESTERN CAPE 2014
50
Figure 1-50: Long Term CO
2
Trend at Oudtshoorn (Oct 2011 – Dec 2013)
1.1.8. George (Eden District, George Municipality)
The George monitoring station was commissioned at the George Municipal swimming pool during July
2010. The monitoring station is located in a residential area surrounded by industries and a central
business district (about 1.5km), a heavily used main road and the N2 National Road. The site co-
ordinates of the monitoring station are 33° 58’ 45.75”S and 22° 28’ 22.50”E (Figure 1-51). Table 1-8 shows
the data recovery of all the parameters measured at the station during 2014. SO
2
and PM
10
concentrations are less than 60% and are not reported.
Figure 1-51: Aerial image of the George Ambient Air Quality Monitoring location
Overall, the meteorological conditions for the period under review were characterized by variable light
to moderate winds, with strong westerly and south-easterly components and a 10.4% occurrence of
calm conditions (Figure 1-52).
Table 1-8: George Data Capture after quality control (2014)
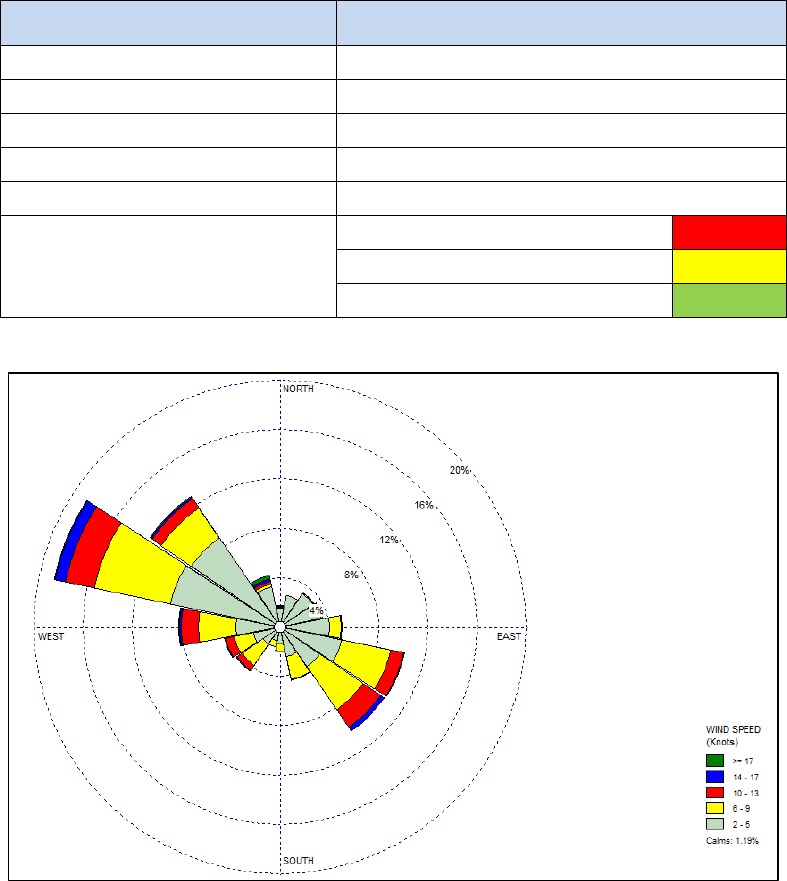
STATE OF AIR QUALITY MANAGEMENT: WESTERN CAPE 2014
51
Measurement
% Data Capture
Carbon Monoxide (CO)
91
Ozone (O
3
)
72
Nitrogen Dioxide (NO
2
)
87
Sulphur Dioxide (SO
2
)
<60
Particulates (PM
10
)
<60
Legend Description on Graphs
Power Failure
Data Capture Failure
Instrument Failure
Figure 1-52: Annual wind rose for George (2014)
1.1.8.1. Carbon Monoxide (CO)
The CO concentrations measured at the George monitoring station are shown in Figure 1-53. CO levels
remained low during the monitoring period. The CO (8 – hour, calculated on 1 hourly averages) SA-
AAQS of 10 mg/m
3
, were not exceeded during the monitoring period.
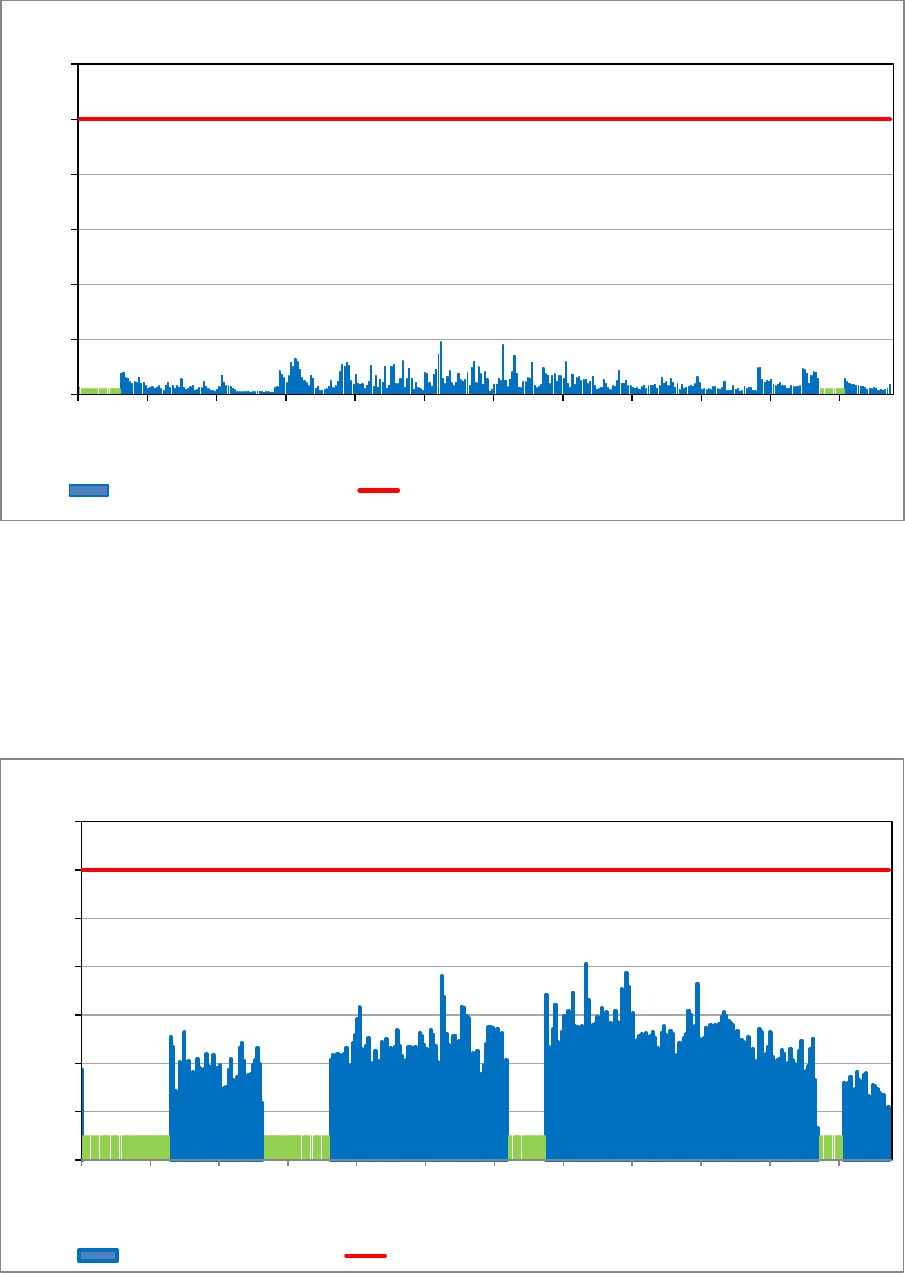
STATE OF AIR QUALITY MANAGEMENT: WESTERN CAPE 2014
52
Figure 1-53: Daily Maximum (8 – hour Mean) for CO at George (2014)
1.1.8.2. Ozone (O
3
)
The O
3
concentrations measured at the George monitoring station are shown in Figure 1-54. The
highest O
3
level recorded during this period was 81 µg/m³ on 17 August 2014. The O
3
(8 – hours, running)
SA-AAQS of 120 µg/m³ were not exceeded during this period.
Figure 1-54: The O
3
concentrations (8 – hour Mean) at George (2014)
1.1.8.3. Nitrogen Dioxide (NO
2
)
The NO
2
concentrations measured at the George monitoring station are shown in Figure 1-55. The NO
2
(1 - hour) SA-AAQS of 200 µg/m
3
was exceeded on 7 April (211 µg/m
3
) during the monitoring period.
0
2
4
6
8
10
12
Jan Feb Mar Apr May Jun Jul Aug Sep Oct Nov Dec
Concentration (mg/m
3
)
Period (months)
Daily Maximum 8-hr Mean Concentrations for CO at George
1 January - 31 December 2014
CO Concentration (mg/m3) SA Ambient AQ Standard (mg/m3) (8hr running mean)
0
20
40
60
80
100
120
140
Jan Feb Mar Apr May Jun Jul Aug Sep Oct Nov Dec
Concentration (µg/m
3
)
Period (months)
Daily Maximum 8-hr Mean Concentrations for O
3
at George
1 January - 31 December 2014
O3 Concentration µg/m3 SA Ambient AQ Standard (µg/m3) (8hr running mean)
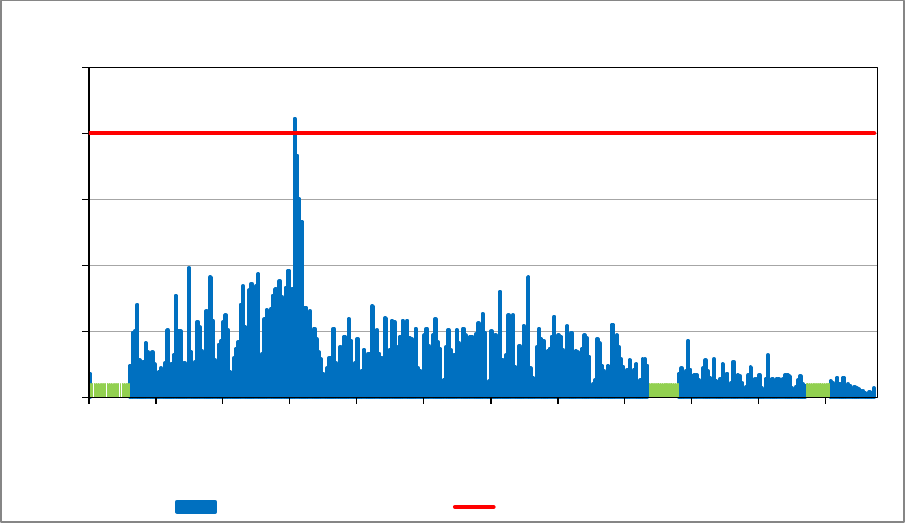
STATE OF AIR QUALITY MANAGEMENT: WESTERN CAPE 2014
53
Figure 1-55: Daily Maximum (1 – hour Mean) for NO
2
at George (2014)
1.1.8.4. Long Term Air Quality Trends for George
Overall, all parameters measured were below the SA-AAQS, except for NO
2
measured in 2011, as
shown in Figure 1-52 to Figure 1-56.
The long term CO values measured at the George monitoring station (Figure 1-56) shows a slight
increase from approximately 0.5 µg/m
3
to 1 µg/m
3
, however, still much below the SA-AAQS of 10 µg/m
3
.
The long term O
3
concentrations measured at the George monitoring station (Figure 1-57) shows a
steady concentration of approximately 50 µg/m
3
. There appears to be a seasonal cycle present with
lower values in December compared to July.
The long term NO
2
values measured at the George monitoring station (Figure 1-58) shows a steady
decline from approximately 70 µg/m
3
to 40 µg/m
3
.
The long term PM
10
measured at the George monitoring station, as shown in Figure 1-59, shows a steady
concentration of approximately 20 µg/m
3
.
0
50
100
150
200
250
Jan Feb Mar Apr May Jun Jul Aug Sep Oct Nov Dec
Concentration (µg/m
3
)
Period (months)
Daily Maximum Hourly Mean for NO
2
at George
1 January - 31 December 2014
NO2 concentration µg/m3 SA Ambient AQ Standard (µg/m3) (1 - hr mean)
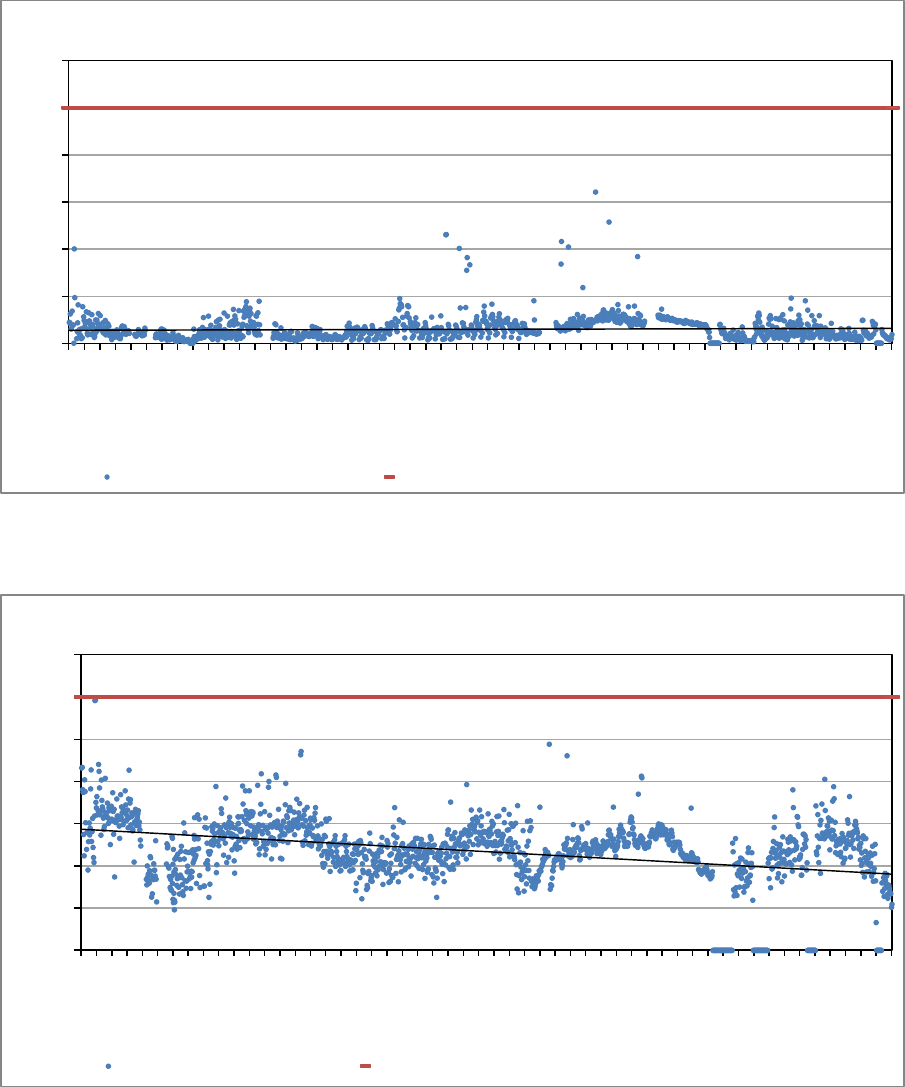
STATE OF AIR QUALITY MANAGEMENT: WESTERN CAPE 2014
54
Figure 1-56: Long Term CO trend at George (Jul 2010 – Dec 2014)
Figure 1-57: Long term O
3
trend at George (Jul 2010 – Dec 2014)
0
2
4
6
8
10
12
Jul 2010
Aug 2010
Sep 2010
Oct 2010
Nov 2010
Dec 2010
Jan 2011
Feb 2011
Mar 2011
Apr 2011
May 2011
Jun 2011
Jul 2011
Aug 2011
Sep 2011
Oct 2011
Nov 2011
Dec 2011
Jan 2012
Feb 2012
Mar 2012
Apr 2012
May 2012
Jun 2012
Jul 2012
Aug 2012
Sep 2012
Oct 2012
Nov 2012
Dec 2012
Jan 2013
Feb 2013
Mar 2013
Apr 2013
May 2013
Jun 2013
Jul 2013
Aug 2013
Sep 2013
Oct 2013
Nov 2013
Dec 2013
Jan 2014
Feb 2014
Mar 2014
Apr 2014
May 2014
Jun 2014
Jul 2014
Aug 2014
Sep 2014
Oct 2014
Nov 2014
Dec 2014
Concentration (mg/m
3
)
Period (months)
Daily Maximum 8-hr Mean Concentrations for CO at George
July 2010 - December 2014
CO Concentration (mg/m3) SA Ambient AQ Standard (mg/m3) (8hr running mean)
0
20
40
60
80
100
120
140
Jul 2010
Aug 2010
Sep 2010
Oct 2010
Nov 2010
Dec 2010
Jan 2011
Feb 2011
Mar 2011
Apr 2011
May 2011
Jun 2011
Jul 2011
Aug 2011
Sep 2011
Oct 2011
Nov 2011
Dec 2011
Jan 2012
Feb 2012
Mar 2012
Apr 2012
May 2012
Jun 2012
Jul 2012
Aug 2012
Sep 2012
Oct 2012
Nov 2012
Dec 2012
Jan 2013
Feb 2013
Mar 2013
Apr 2013
May 2013
Jun 2013
Jul 2013
Aug 2013
Sep 2013
Oct 2013
Nov 2013
Dec 2013
Jan 2014
Feb 2014
Mar 2014
Apr 2014
May 2014
Jun 2014
Jul 2014
Aug 2014
Sep 2014
Oct 2014
Nov 2014
Dec 2014
Concentration (µg/m
3
)
Period (months)
Daily Maximum 8-hr Mean Concentrations for O
3
at George
July 2010 - December 2014
O3 Concentration µg/m3 SA Ambient AQ Standard (µg/m3) (8hr running mean)
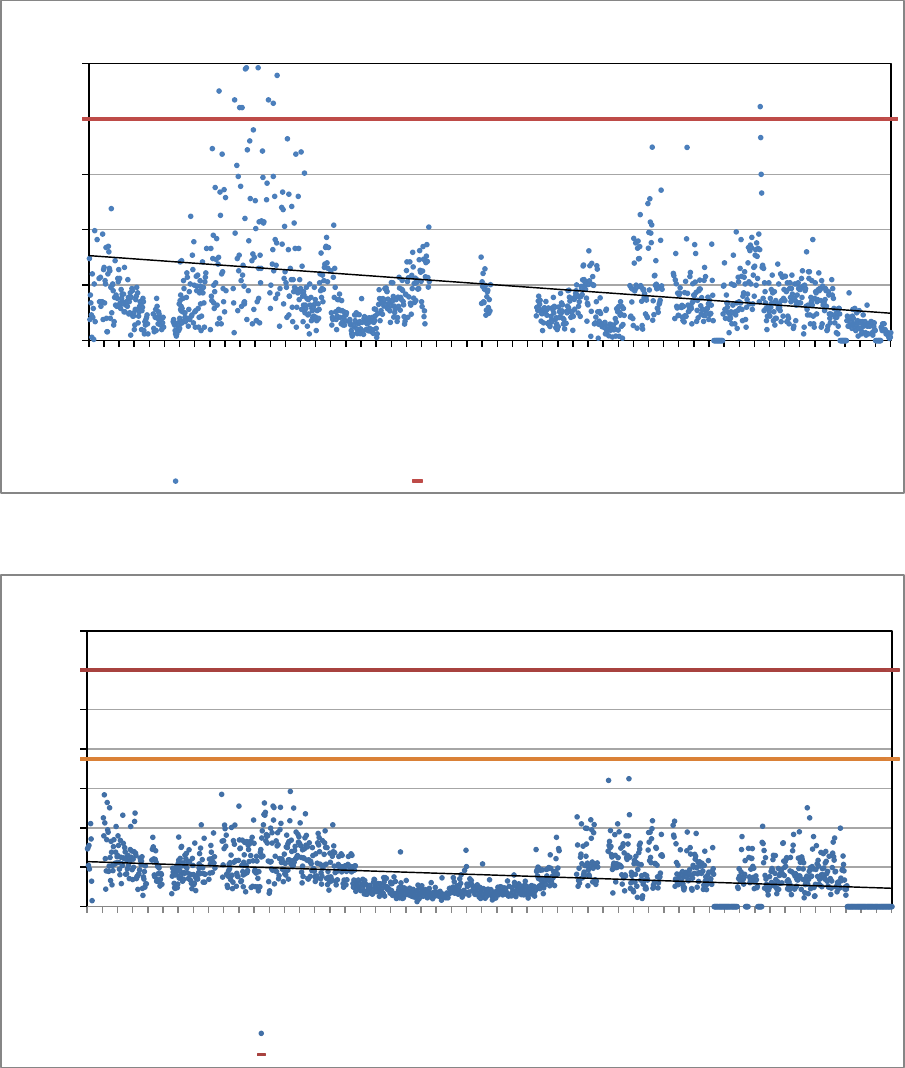
STATE OF AIR QUALITY MANAGEMENT: WESTERN CAPE 2014
55
Figure 1-58: Long Term NO
2
trend at George (Jul 2010 – Dec 2014)
Figure 1-59: Long term PM
10
trend at George (Jul 2010 – Dec 2014)
1.1.9. Dana Bay (Eden District, Mossel Bay Municipality)
The Dana Bay ambient air quality monitoring station is located at the Reservoir in Dana Bay which is
located to the north-eastern part of the town and south-east of the Mossdustria industries and south-
west of the KwaNonqaba Township. Dana Bay is situated on the eastern coastline of the Western Cape
Province. The monitoring station was commissioned in November 2011. The site co-ordinates of the
monitoring station are 34° 11' 29.42"S, 22° 03' 06.61"E (Figure 1-60). Table 1-9 shows the data recovery at
the station during 2014.
0
50
100
150
200
250
Jul 2010
Aug 2010
Sep 2010
Oct 2010
Nov 2010
Dec 2010
Jan 2011
Feb 2011
Mar 2011
Apr 2011
May 2011
Jun 2011
Jul 2011
Aug 2011
Sep 2011
Oct 2011
Nov 2011
Dec 2011
Jan 2012
Feb 2012
Mar 2012
Apr 2012
May 2012
Jun 2012
Jul 2012
Aug 2012
Sep 2012
Oct 2012
Nov 2012
Dec 2012
Jan 2013
Feb 2013
Mar 2013
Apr 2013
May 2013
Jun 2013
Jul 2013
Aug 2013
Sep 2013
Oct 2013
Nov 2013
Dec 2013
Jan 2014
Feb 2014
Mar 2014
Apr 2014
May 2014
Jun 2014
Jul 2014
Aug 2014
Sep 2014
Oct 2014
Nov 2014
Dec 2014
Concentration (µg/m3)
Period (months)
Daily Maximum Hourly Mean for NO
2
at George
July 2010- December 2014
NO2 concentration µg/m3 SA Ambient AQ Standard (µg/m3) (1 - hr mean)
0
20
40
60
80
100
120
140
Jul 2010
Aug 2010
Sep 2010
Oct 2010
Nov 2010
Dec 2010
Jan 2011
Feb 2011
Mar 2011
Apr 2011
May 2011
Jun 2011
Jul 2011
Aug 2011
Sep 2011
Oct 2011
Nov 2011
Dec 2011
Jan 2012
Feb 2012
Mar 2012
Apr 2012
May 2012
Jun 2012
Jul 2012
Aug 2012
Sep 2012
Oct 2012
Nov 2012
Dec 2012
Jan 2013
Feb 2013
Mar 2013
Apr 2013
May 2013
Jun 2013
Jul 2013
Aug 2013
Sep 2013
Oct 2013
Nov 2013
Dec 2013
Jan 2014
Feb 2014
Mar 2014
Apr 2014
May 2014
Jun 2014
Jul 2014
Aug 2014
Sep 2014
Oct 2014
Nov 2014
Dec 2014
Concentration (µg/m
3
)
Period (months)
Daily Mean PM
10
Concentrations at George
July 2010- December 2014
PM10 Concentration (µg/m3)
SA Ambient AQ Standard (µg/m3) (daily average)
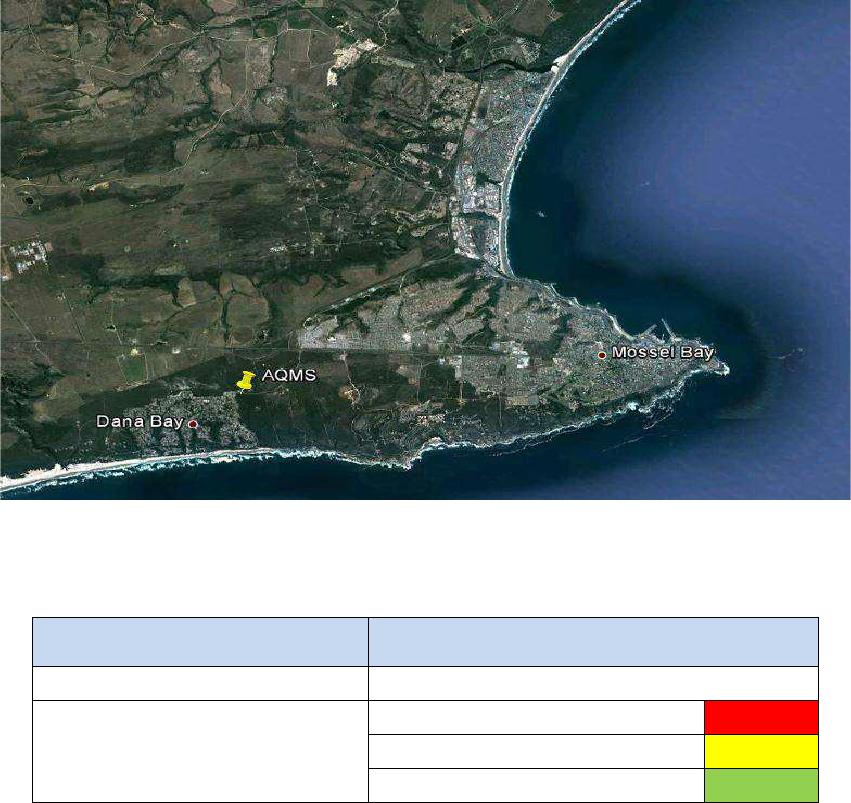
STATE OF AIR QUALITY MANAGEMENT: WESTERN CAPE 2014
56
Figure 1-60: Aerial image of the Dana Bay Ambient Air Quality Monitoring Location
Table 1-9: Dana Bay Data Capture after quality control (2014)
Measurement
% Data Capture
Hydrogen Sulphide (H
2
S)
<60
Legend Description on Graphs
Power Failure
Data Capture Failure
Instrument Failure
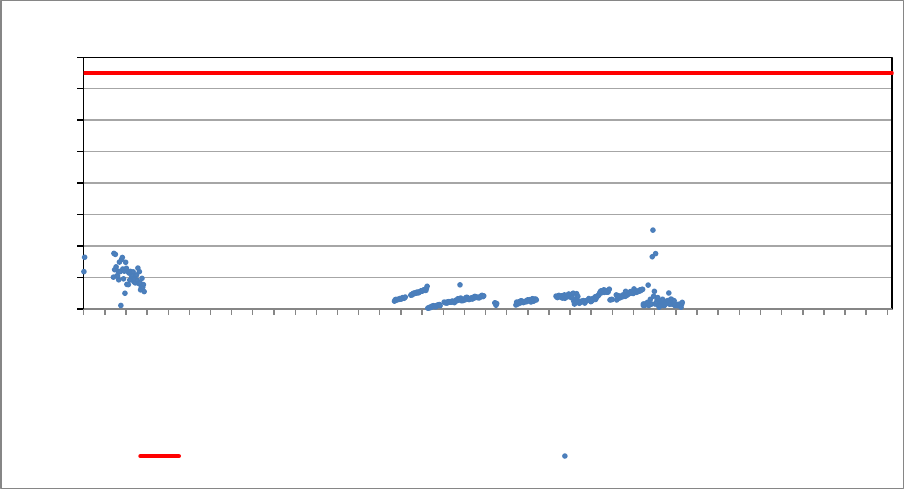
STATE OF AIR QUALITY MANAGEMENT: WESTERN CAPE 2014
57
1.1.9.1. Hydrogen Sulphide (H
2
S)
The H
2
S data recovery was less than 60% during 2014, mainly as a result of equipment failure and / or
electrical/power failure. Figure 1-61 shows the long term trend of H
2
S from October 2011 to December
2014.
Figure 1-61: Dana Bay Long Term H
2
S Trend
1.1.10. Hout Bay (City of Cape Town)
The station commissioned in March 2014, is located at the Sentinel Primary School in Hout Bay
(34˚25’12.42”S; 19˚12’47.37”E) (Figure 1-62). The location of the monitoring station is in a residential area,
in the proximity of industrial activities and a working harbour. H
2
S levels measured at Hout Bay
monitoring station were below 150 µg/m³ in terms of the WHO Air Quality Guideline for health impact
evaluation. The wind rose (Figure 1-63) shows the strongest winds coming from the south east, while
there is also a consistent wind from the north westerly sector during the period monitored. Data loss
occurred in December 2014, due to instrument failures (Table 1-10). No trend data is available for
presentation in this report, due to the Hout Bay monitoring station being commissioned in March 2014.
0
20
40
60
80
100
120
140
160
Oct 2011
Nov 2011
Dec 2011
Jan 2012
Feb 2012
Mar 2012
Apr 2012
May 2012
Jun 2012
Jul 2012
Aug 2012
Sep 2012
Oct 2012
Nov 2012
Dec 2012
Jan 2013
Feb 2013
Mar 2013
Apr 2013
May 2013
Jun 2013
Jul 2013
Aug 2013
Sep 2013
Oct 2013
Nov 2013
Dec 2013
Jan 2014
Feb 2014
Mar 2014
Apr 2014
May 2014
Jun 2014
Jul 2014
Aug 2014
Sep 2014
Oct 2014
Nov 2014
Dec 2014
Concentration (µg/m
3
)
Period (months)
Daily Maximum Hourly Mean for H
2
S at Dana Bay
October 2011 - December 2014
WHO Guideline (150 µg/m³) H₂S concentration
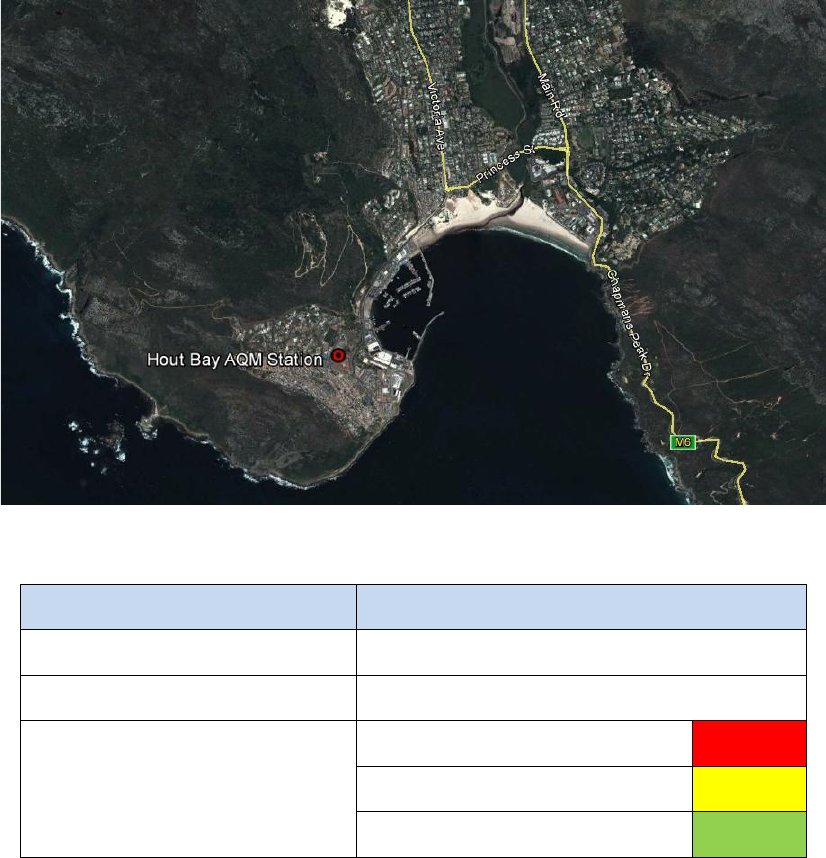
STATE OF AIR QUALITY MANAGEMENT: WESTERN CAPE 2014
58
Figure 1-62: Aerial image of Hout Bay Ambient Air Quality Monitoring location
Table 1-10: Hout Bay Data Capture after quality control (2014)
Measurement
% Data Capture
Hydrogen Sulphide (H
2
S)
99
Legend Description on Graphs
Power Failure
Legend Description on Graphs
Data Capture Failure
Instrument Failure
Instrument Failure
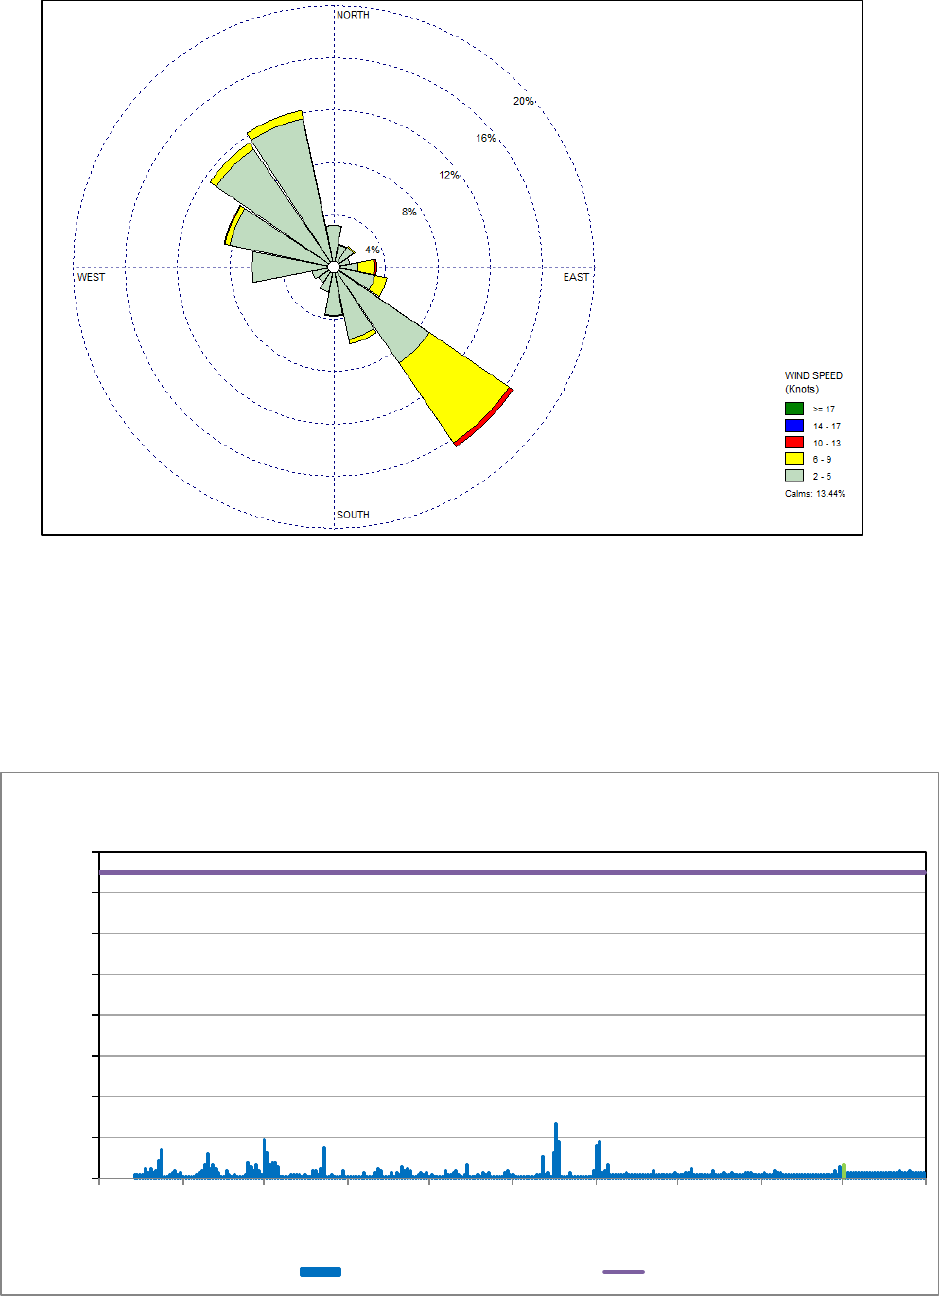
STATE OF AIR QUALITY MANAGEMENT: WESTERN CAPE 2014
59
Figure 1-63: Annual Wind Rose for Hout Bay (2014)
1.1.10.1. Hydrogen Sulphide (H
2
S)
The monitoring of H
2
S is used as an indicator of odour emissions from the industries. The daily maximum
hourly mean H
2
S concentrations measured at the Hout Bay monitoring station is presented in Figure
1-64. The highest H
2
S level recorded during this period was 27 µg/m³ on 17 August 2014. The H
2
S
concentrations can likely be attributed to the industries operating in the Hout Bay area.
Figure 1-64: Daily Maximum H
2
S (Hourly Mean) at Hout Bay (2014)
1.1.11. Hermanus (Overberg)
The Hermanus ambient air quality monitoring station is located at the Mount Pleasant Primary School in
Hermanus which is located to the west of the town and between the major road (R43) into Hermanus
0
20
40
60
80
100
120
140
160
Mar Apr May Jun Jul Aug Sep Oct Nov Dec
Concentration (µg/m
3
)
Period (months)
Daily Maximum Hourly Mean for H
2
S at Hout Bay
1 March - 31 December 2014
H₂S concentration
WHO Guideline (150 µg/m³)
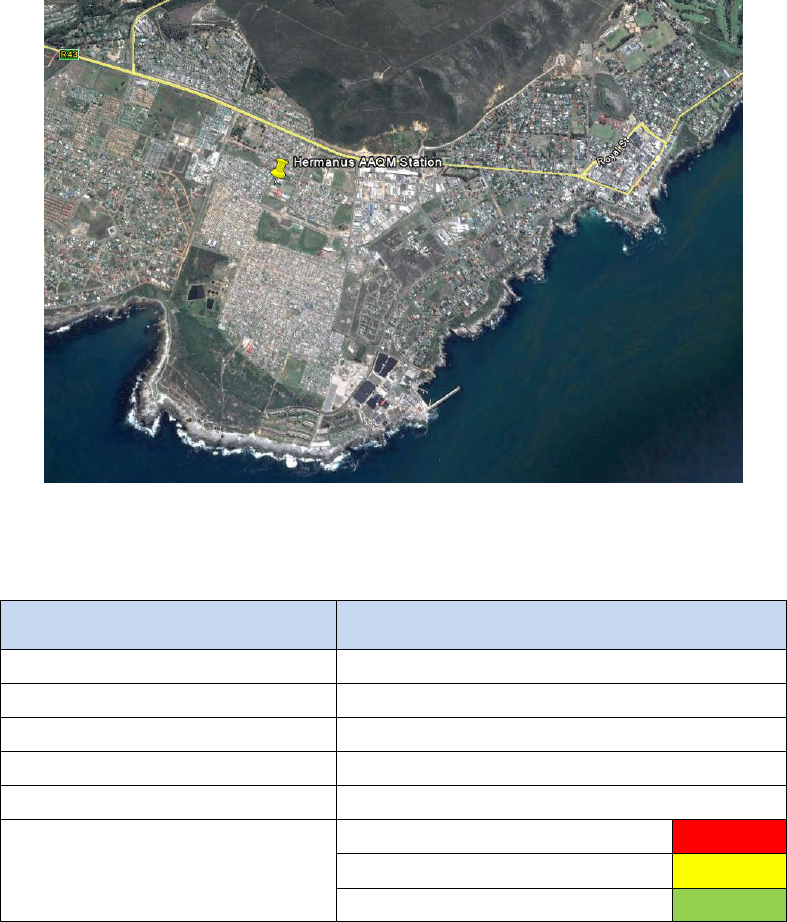
STATE OF AIR QUALITY MANAGEMENT: WESTERN CAPE 2014
60
and the coastline to the south. Hermanus is situated on the southern coastline of the Western Cape
Province (Figure 1-65). The monitoring station was commissioned in March 2014. The site co-ordinates of
the monitoring station are 34°25'12.40"S, 19°12'47.17"E. Table 1-11 shows the data recovery at the station
during 2014. The data recovery was less than 60% during 2014, mainly as a result of electrical/power
failure and therefore no data is displayed for Hermanus.
Figure 1-65: Aerial image of the Hermanus Ambient Air Quality Monitoring Location
Table 1-11: Hermanus Data Capture after quality control (2014)
Measurement
% Data Capture
Carbon Monoxide (CO)
<60
Ozone (O
3
)
<60
Nitrogen Dioxide (NO
2
)
<60
Sulphur Dioxide (SO
2
)
<60
Particulates (PM
10
)
<60
Legend Description on Graphs
Power Failure
Data Capture Failure
Instrument Failure
1.2. MUNICIPAL AMBIENT AIR QUALITY MONITORING: City of Cape Town (CoCT)
The City of Cape Town’s Air Quality Monitoring Network consists of 13 ambient air quality monitoring
stations, as indicated in Figure 1-66 This Network is further complemented by two additional continuous
ambient air quality monitoring stations, which are operated by D: EA&DP at Vissershok and Khayelitsha
(Section 1.1). The CoCT’s Athlone station serves as an audit station for the entire city network, while the
STATE OF AIR QUALITY MANAGEMENT: WESTERN CAPE 2014
61
Killarney station is a fence line monitoring station for the Chevron Refinery. As such, these stations are
not regarded as ambient air quality monitoring stations for the area and are therefore not reported on.
Numerous and widespread regional sources including industry, road traffic, power generation and the
domestic use of fuels by a large sector of the population contribute to the air pollution over Cape
Town. Coupled with this, despite the region’s generally high potential for air pollution dispersion and
ventilation from the metropolitan area, the cleansing effects of the summer South-Easter or 'Cape
Doctor' contribute to increased dust levels in summer.
A combination of local topography (mountain range forms a basin that traps pollution) and climate
cause the city to be susceptible to air pollution during autumn and winter inversions. Early morning
inversion layers often coincide with morning peak traffic conditions, causing visible levels of air pollution
in the form of a white or brown haze (City of Cape Town, 2005). Studies of the brown haze and air
pollution episodes showed that PM
10
forms a major part of the city pollution (Benson, 2007).
Particulate matter (PM) with an aerodynamic diameter less than 10µm (PM
10
) have caused concern
because of their potential harmful effects on human health. Exposure to high levels of PM
10
concentrations is associated with increased incidences of respiratory ailments such as asthma and
chronic bronchitis. Studies on PM
10
indicate that there is no threshold in particulate concentrations
below which health would not be jeopardized.
Air pollution instrumentation that use spectrometric and chemiluminescent technology continuously
measures SO
2
, NO, NO
2
, NO
x
, O
3
and H
2
S. PM
10
monitoring is done by means of a TEOM 1400A which
uses a Tapered Element Oscillating Mass (TEOM) balance to continuously weigh particles of less than
10µm in diameter in the air. VOC’s (benzene, toluene, ethylacetate and xylene) are monitored using
GC mass spectrometry technology. All these analysers are USEPA approved and are operated in
accordance with the USEPA methods and SANAS ISO 17025 requirements.

STATE OF AIR QUALITY MANAGEMENT: WESTERN CAPE 2014
62
Figure 1-66: The City of Cape Town’s Air Quality Monitoring Network
The ambient air is measured on a continuous basis every 10 seconds and all data are collected on a
central server at the CoCT’s Scientific Services Department. The data is processed daily to minute, 10
minute, 15 minute, 1 hour, 8-hr and daily averages. These averages are compared against guidelines
and guideline exceedances are reported on daily on the CoCT’s Air Quality Website,
(www.capetown.gov.za/airqual), as well as monthly reports.
The CoCT developed and published an Air Quality Management Plan as a tool for the management of
the air quality in order to protect human health and the environment as part of their constitutional
responsibility as Local Authority to comply with NEM: AQA.
“To specify ambient air quality standards and targets for Cape Town” is one of the key objectives
presented in the CoCT’s Air Quality Management Plan. Ambient air quality guideline levels indicate
safe daily exposure levels for the majority of the population.
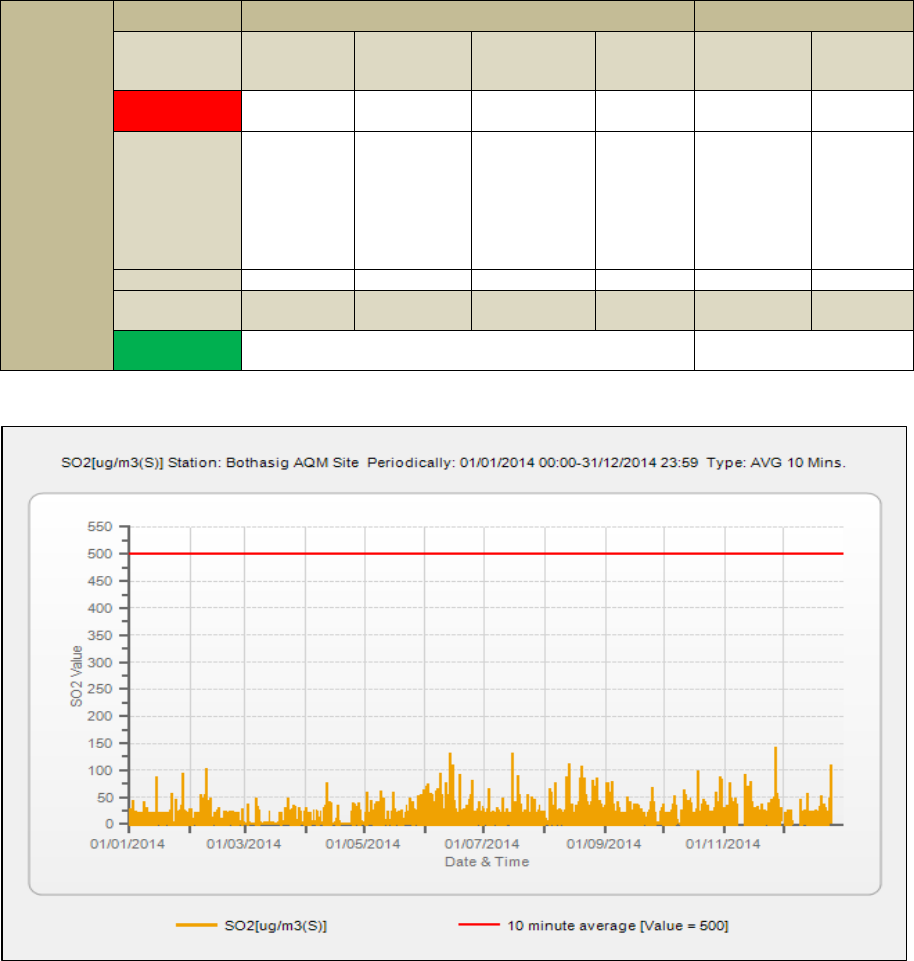
STATE OF AIR QUALITY MANAGEMENT: WESTERN CAPE 2014
63
1.2.1. Bothasig
The Bothasig monitoring station forms part of the Milnerton air quality monitoring network. The primary
aim of this monitoring network is to monitor the impact of the Chevron Refinery and other emitters from
the area, on ambient air quality.
Ambient monitoring at Bothasig Monitoring Station commenced during 1995. The pollutants measured
are SO
2
and NOx. PM
10
monitoring stopped during 2003. The analyses of the results are shown in Table
1-12, Figure 1-67, Figure 1-68, Figure 1-69, Figure 1-70, Figure 1-71 and Figure 1-72.
Table 1-12: Bothasig SO
2
and
NO
2
Frequency of Exceedances and Data Recovery (2014)
Bothasig
Pollutant
SO
2
NO
2
Averaging
Period
10 minute
average
1 hour
average
24 hour daily
average
1 year
(annual
average)
1 hour
average
1 year
(annual
average)
RSA AQ
Standard
500µg/m³
350µg/m³
125µg/m³
50µg/m³
200µg/m³
40µg/m³
Maximum/
Average
129µg/m³
(highest 10
minute
average
recorded
on the
27/11/2014)
107µg/m³
(highest 1
hour
average
recorded
on the
27/11/2014)
24µg/m³
(highest daily
average
recorded on
the
27/11/2014
4µg/m³
(annual
average)
128µg/m³
(highest 1
hour
average
recorded
on the
11/04/2014)
8µg/m³
(annual
average)
Exceedence
0
0
0
0
0
0
Frequency of
Exceedence
526
88
4
0
88
0
Data
Capture %
91
91
Figure 1-67: Bothasig 10 – minute average for SO
2
(1January 2014 – 31 December 2014)
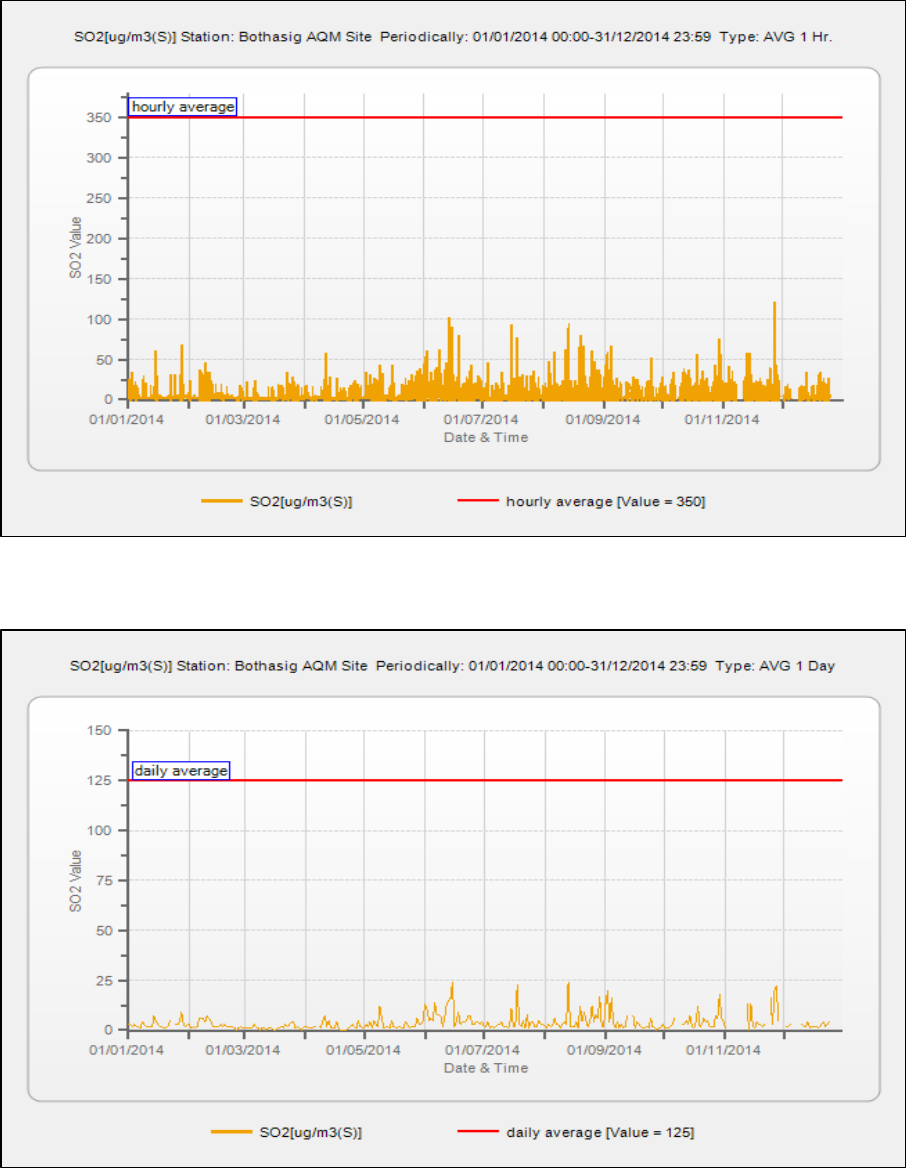
STATE OF AIR QUALITY MANAGEMENT: WESTERN CAPE 2014
64
Figure 1-68: Bothasig 1 – hourly average for SO
2
(1January 2014 – 31 December 2014)
Figure 1-69: Bothasig 24 – hour average for SO
2
(1January 2014 – 31 December 2014)
Bothasig SO
2
did not exceed any of the SO
2
standards for the period 1 January 2014 – 31 December
2014. The annual average for SO
2
was 4µg/m³ for the period 1 January 2014 – 31 December 2014. The
data capture for the period was 91%.
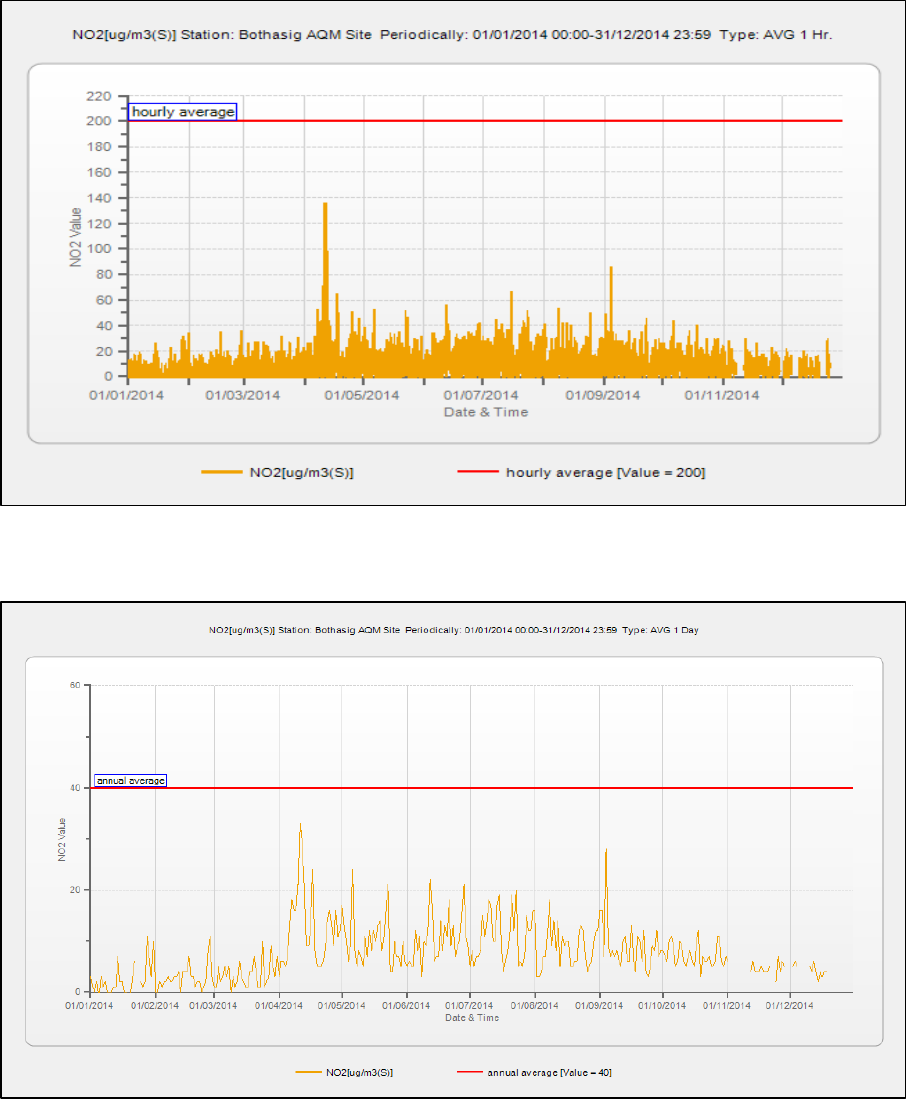
STATE OF AIR QUALITY MANAGEMENT: WESTERN CAPE 2014
65
Figure 1-70: Bothasig 1 – hourly average for NO
2
(1January 2014 – 31 December 2014)
Figure 1-71: Bothasig annual average for NO
2
(1January 2014 – 31 December 2014)
Bothasig NO
2
did not exceed any of the standards for the period 1 January 2014 – 31 December 2014.
The highest hourly average recorded for NO
2
was 128µg/m³ on the 11 April 2014. The annual average
for NO
2
was 8µg/m³ for the period 1 January 2014 – 31 December 2014. The data capture for NO
2
was
91%.
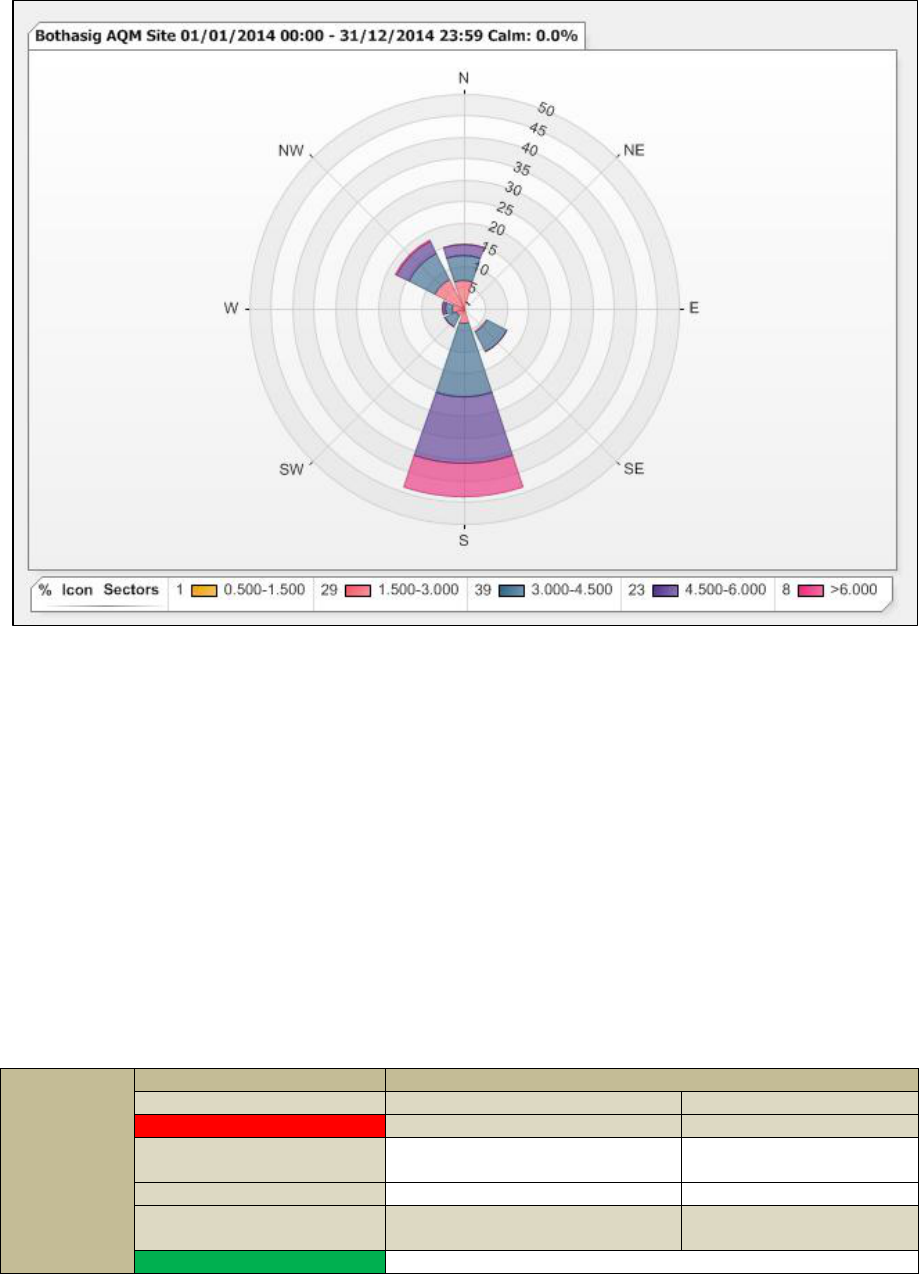
STATE OF AIR QUALITY MANAGEMENT: WESTERN CAPE 2014
66
Figure 1-72: Bothasig annual wind rose (1January 2014 – 31 December 2014)
The meteorological conditions for the period were characterized by prevalent southerly winds in the
Bothasig area.
1.2.2. Foreshore
The Foreshore monitoring station was sited to assess vehicular emissions and to characterize emissions
from other nearby sources such as the Port activities in the area.
Ambient NO
2
and PM
10
monitoring commenced during 1995. The trend graphs show the monthly
averages. The analyses of the results are shown in Table 1-13, Figure 1-73 and Figure 1-74
Table 1-13: Foreshore PM10 Frequency of Exceedances and Data Recovery (2014)
Foreshore
Pollutant
PM
10
Averaging Period
24 hour daily average
1 year (annual average)
RSA AQ Standard
120µg/m³
50µg/m³
Maximum / Average
50µg/m³ (highest daily average
recorded on the 27/10/2014)
20µg/m³ (annual
average)
Exceedence
0
0
Frequency of
Exceedence
4
0
Data Capture %
44
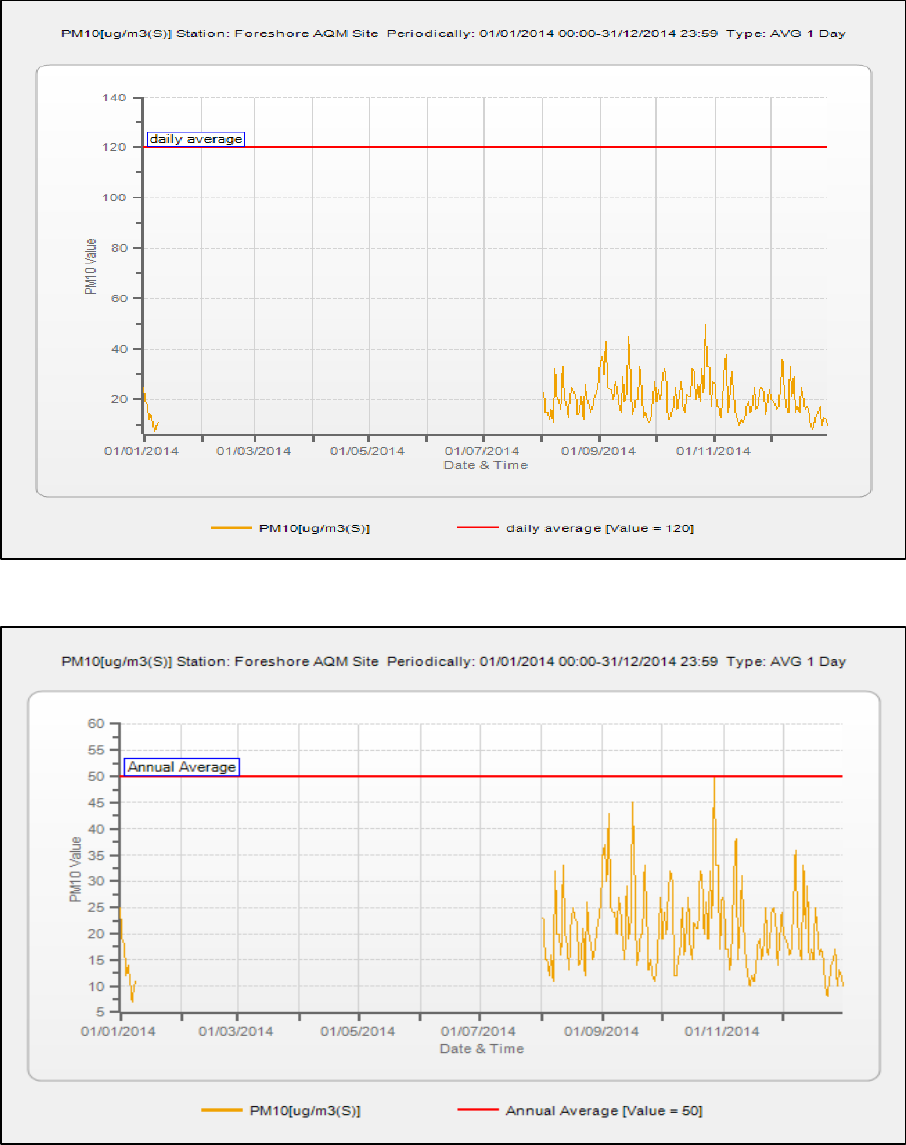
STATE OF AIR QUALITY MANAGEMENT: WESTERN CAPE 2014
67
Figure 1-73: Foreshore 24 – hour average for PM
10
(1January 2014 – 31 December 2014)
Figure 1-74: Foreshore annual average for PM
10
(1January 2014 – 31 December 2014)
Foreshore PM
10
did not exceed the daily and annual average for the period 1 January 2014 – 31
December 2014. The highest 24 hour average recorded for PM
10
was 50µg/m³ on the 27 October 2014.
The annual average for PM
10
is 20µg/m³. The data capture for the period was 44%. The low data
recovery is due to air conditioner problems experienced during the period 10 January 2014 – 01 August
2014. The daily and annual average must be viewed with caution due to the low data recovery.
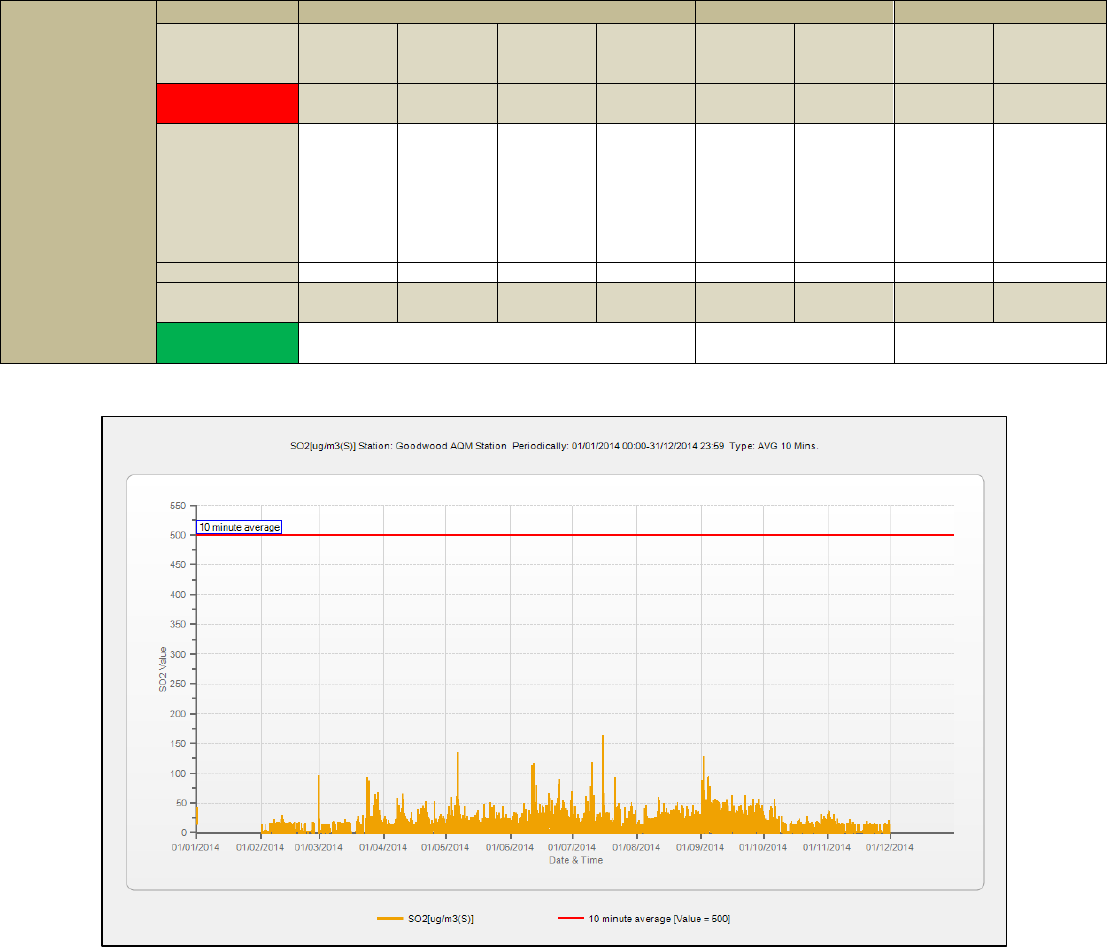
STATE OF AIR QUALITY MANAGEMENT: WESTERN CAPE 2014
68
1.2.3. Goodwood
The Goodwood monitoring station serves as a Regional station to monitor background air pollution
levels. Ambient monitoring at Goodwood Monitoring Station commenced during 1993. The pollutants
measured are SO
2
, NOx, O
3
and CO. Monitoring of CO stopped during 2007 and O
3
monitoring
stopped during 2008 due to broken instruments. The analyses of the results are shown in Table 1-14,
Figure 1-75, Figure 1-76, Figure 1-77, Figure 1-78 Figure 1-79, Figure 1-80, Figure 1-81 and Figure 1-82.
Table 1-14: Goodwood SO
2
, NO
2
and PM
10
Frequency of Exceedances and Data Recovery
(2014)
Goodwood
Pollutant
SO
2
NO
2
PM
10
Averaging
Period
10 minute
average
1 hour
average
24 hour
daily
average
1 year
(annual
average)
1 hour
average
1 year
(annual
average)
24 hour
daily
average
1 year
(annual
average)
RSA AQ
Standard
500µg/m³
350µg/m³
125µg/m³
50µg/m³
200µg/m³
40µg/m³
120µg/m³
50µg/m³
Maximum/
Average
151µg/m³
(highest
10 minute
average
recorded
on the 15
July 2014
109µg/m³
(highest 1
hour
average
recorded
on the 15
July 2014
39µg/m³
(highest
daily
average
recorded
on the 4
Sep 2014
8µg/m³
(annual
average)
207µg/m³
(highest 1
hour
average
recorded
on the 11
June 2014
21µg/m³
(annual
average)
67µg/m³
(highest
daily
average
recorded
on the 23
May 2014
27µg/m³
(annual
average)
Exceedence
0
0
0
0
1
0
0
0
Frequency of
Exceedence
526
88
4
0
88
0
4
0
Data Capture
%
76
85
89
Figure 1-75: Goodwood 10 – minute average for SO
2
(1January 2014 – 31 December 2014)
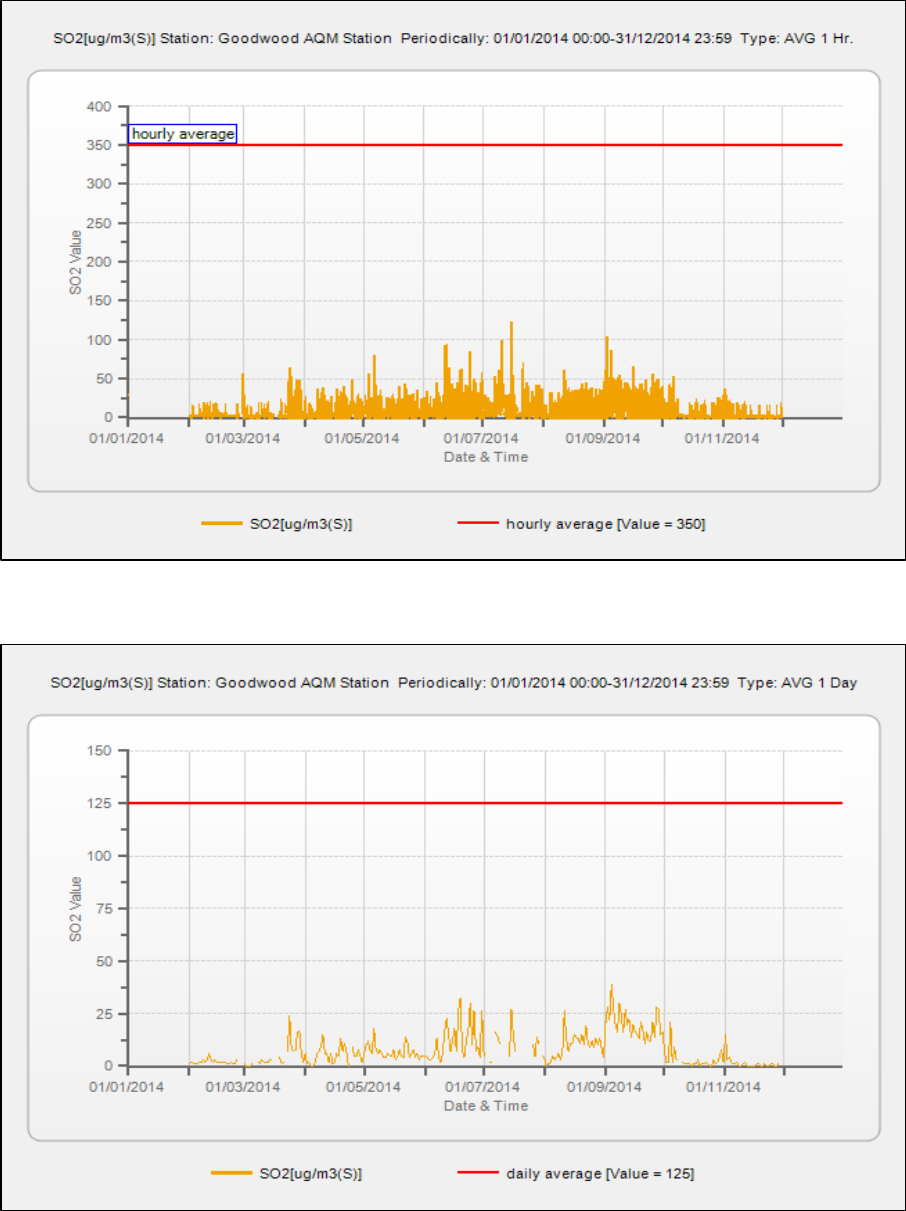
STATE OF AIR QUALITY MANAGEMENT: WESTERN CAPE 2014
69
Figure 1-76: Goodwood 1 - hour average for SO
2
(1January 2014 – 31 December 2014)
Figure 1-77: Goodwood 24 - hour average for SO
2
(1January 2014 – 31 December 2014)
SO
2
for Goodwood did not exceed any of the SO
2
standards for the period 1 January 2014 – 31
December 2014. The annual average for SO
2
was 8µg/m³ for the period 1 January 2014 – 31 December
2014. The data capture for the period was 76%. The loss of data was due to faulty analyser during
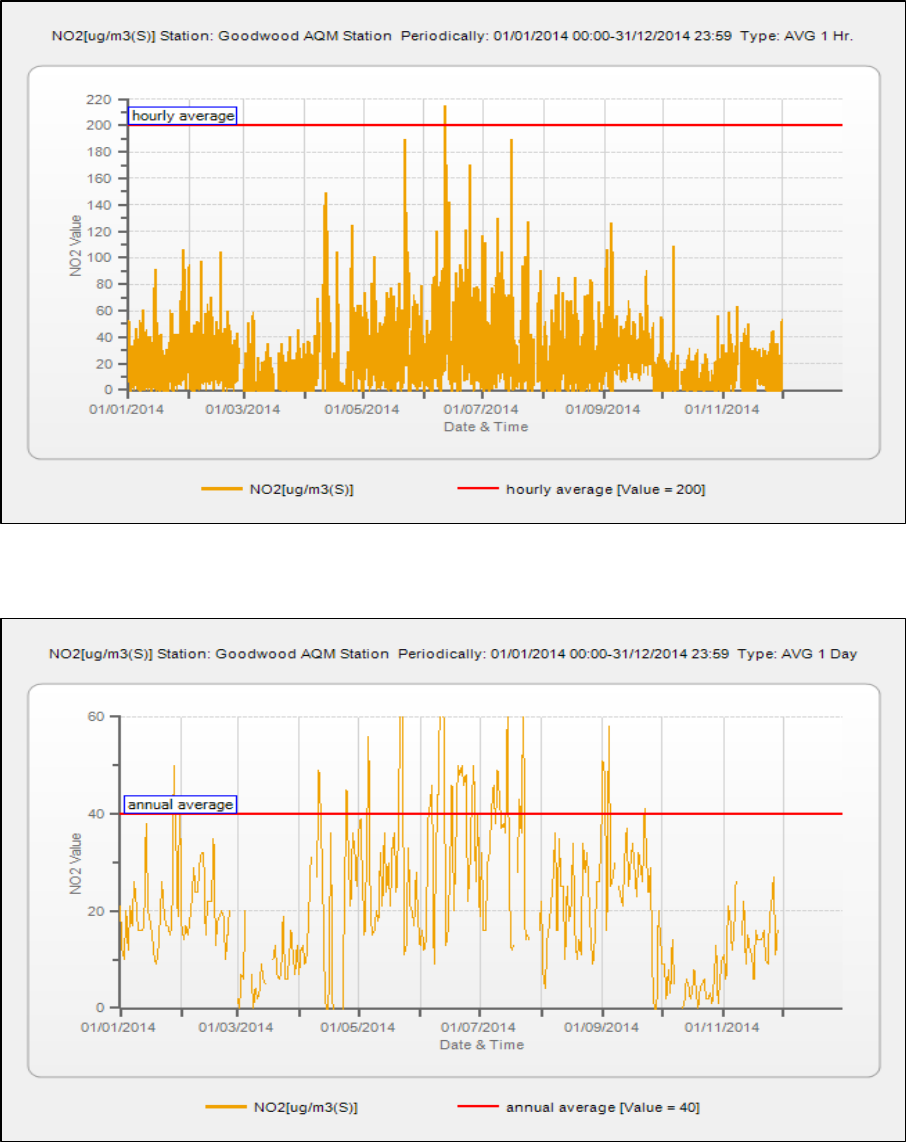
STATE OF AIR QUALITY MANAGEMENT: WESTERN CAPE 2014
70
January 2014. Further data loss occurred during December 2014 as a result of operations shut down
due to a faulty air conditioner.
Figure 1-78: Goodwood 1 - hourly average for NO
2
(1January 2014 – 31 December 2014)
Figure 1-79: Goodwood annual average for NO
2
(1January 2014 – 31 December 2014)
The hourly NO
2
average of 200µg/m³ was exceeded on 1 occasion on the 11 June 2014. 2014. The
highest hourly average recorded for NO
2
was 207µg/m³ on the 11 June 2014. The annual average for
NO
2
was 21µg/m³ for the period 1 January 2014 – 31 December 2014. The data capture for NO
2
was
85%.
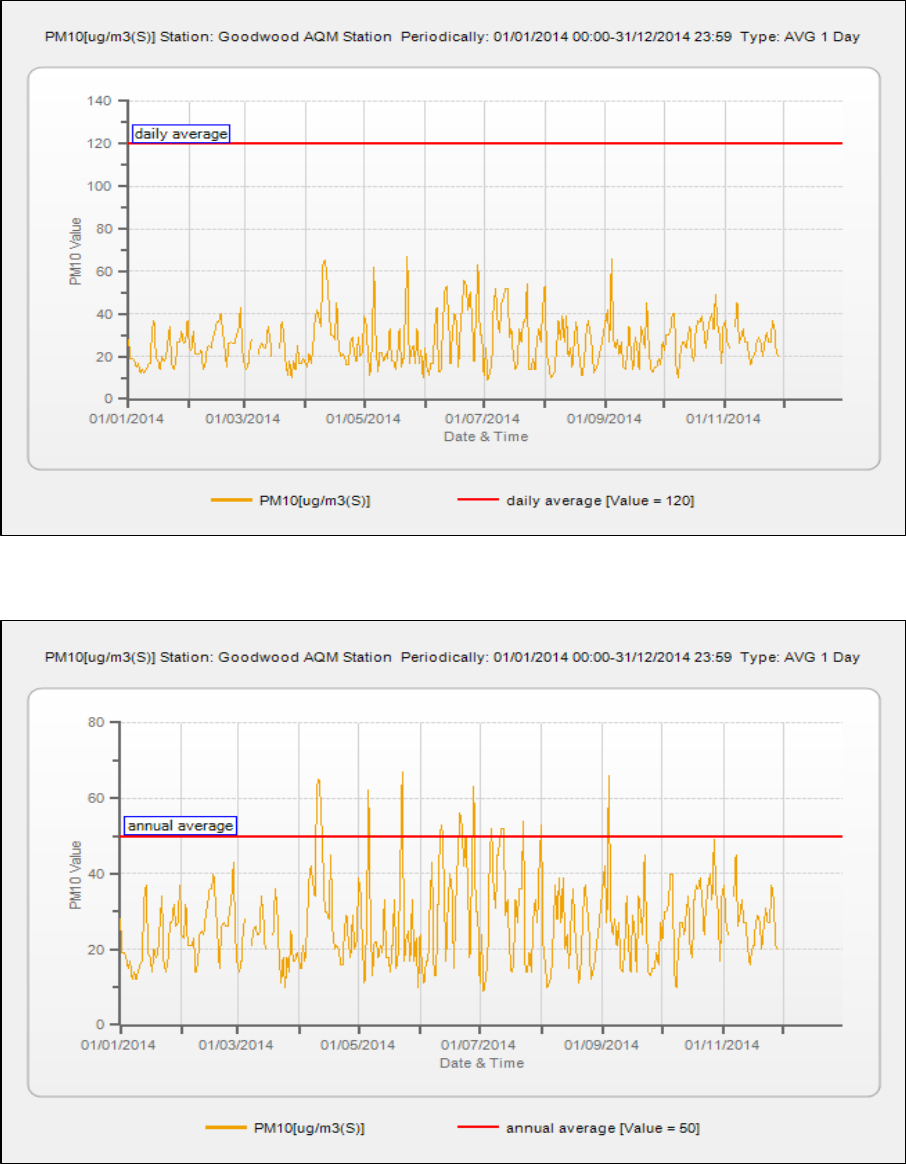
STATE OF AIR QUALITY MANAGEMENT: WESTERN CAPE 2014
71
Figure 1-80: Goodwood 24 - hour average for PM
10
(1January 2014 – 31 December 2014)
Figure 1-81: Goodwood annual average for PM
10
(1January 2014 – 31 December 2014)
PM
10
for Goodwood did not exceed the daily and annual average for the period 1 January 2014 – 31
December 2014. The highest 24 hour (daily) average recorded for PM
10
was 67µg/m³ on the 23 May
2014. The annual average for PM
10
was 27µg/m³. The data capture for the period was 89%.
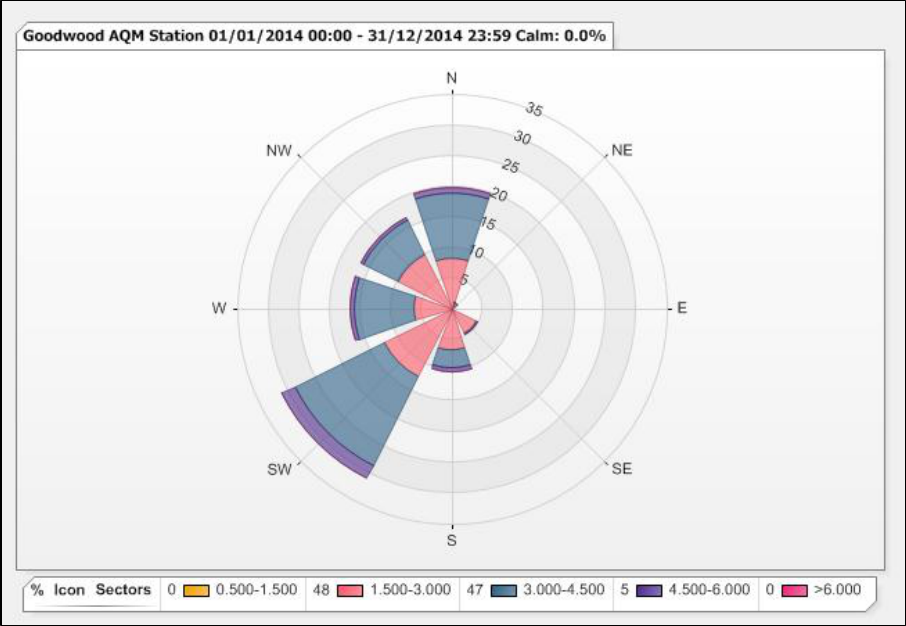
STATE OF AIR QUALITY MANAGEMENT: WESTERN CAPE 2014
72
Figure 1-82: Goodwood annual wind rose (1January 2014 – 31 December 2014)
The meteorological conditions for the period were characterized by prevalent south – westerly winds in
the Goodwood area.
1.2.4. Khayelitsha
The Khayelitsha monitoring station was established to assess the impact of emissions from informal
settlement related activities on ambient air quality in the area. Ambient air quality monitoring at
Khayelitsha Monitoring Station commenced during 2002.
The pollutants measured are SO
2
, NOx and PM
10
. The analyses of the results are shown in Table 1-15,
Figure 1-83, Figure 1-84, Figure 1-85, Figure 1-86, Figure 1-87, Figure 1-88 and Figure 1-89.
Table 1-15: Khayelitsha SO
2
, NO
2
and PM
10
Frequency of Exceedances and Data Recovery (2014)
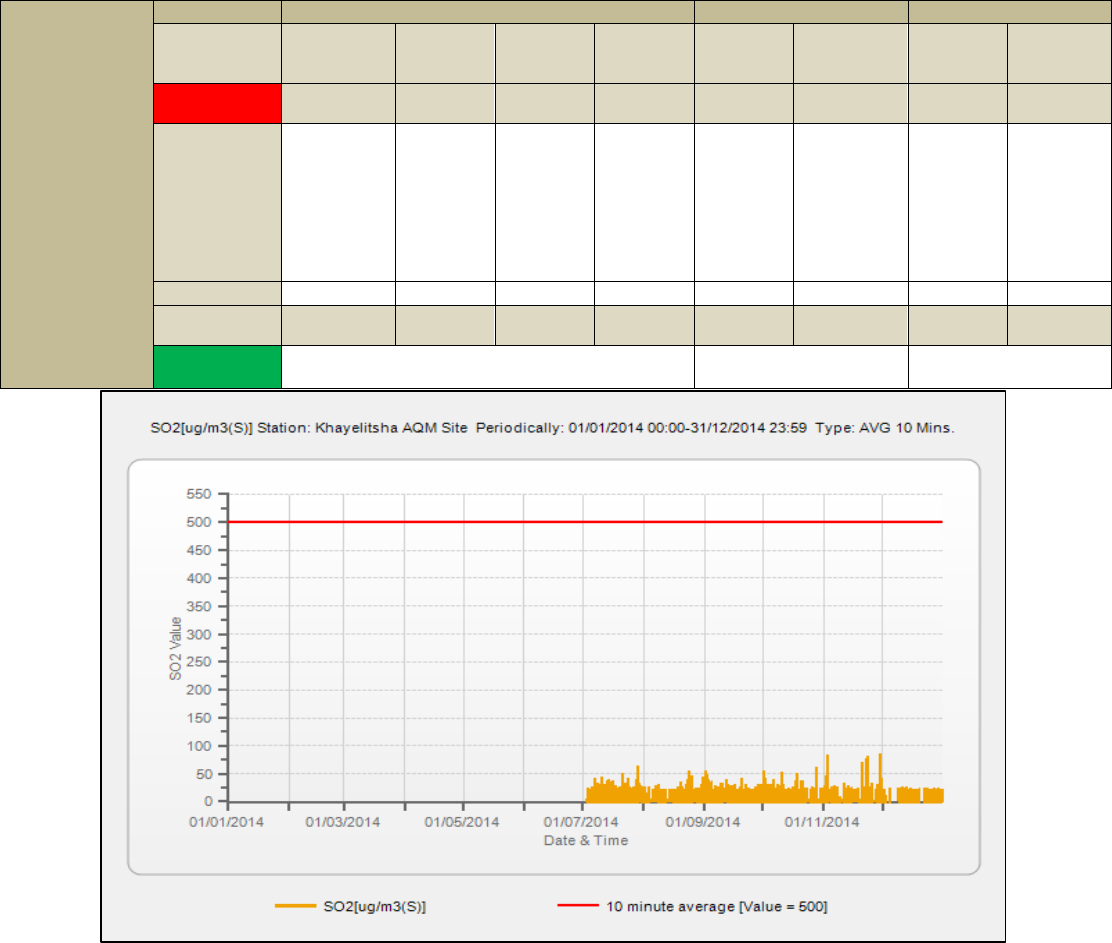
STATE OF AIR QUALITY MANAGEMENT: WESTERN CAPE 2014
73
Figure 1-83: Khayelitsha 10 – minute average for SO
2
(1January 2014 – 31 December 2014)
Khayelitsha
Pollutant
SO
2
NO
2
PM
10
Averaging
Period
10 minute
average
1 hour
average
24 hour
daily
average
1 year
(annual
average)
1 hour
average
1 year
(annual
average)
24 hour
daily
average
1 year
(annual
average)
RSA AQ
Standard
500µg/m³
350µg/m³
125µg/m³
50µg/m³
200µg/m³
40µg/m³
120µg/m³
50µg/m³
Maximum /
Average
66µg/m³
(highest 10
minute
average
recorded
on the 29
November
2014
35µg/m³
(highest 1
hour
average
recorded
on the 29
July 2014
11µg/m³
(highest
daily
average
recorded
on the 02
Sep 2014
2µg/m³
(annual
average)
441µg/m³
(highest 1
hour
average
recorded
on the 29
July 2014
39µg/m³
(annual
average)
125µg/m³
(highest
daily
average
recorded
on the 15
July 2014
44µg/m³
(annual
average)
Exceedence
0
0
0
0
40
0
1
0
Frequency of
Exceedence
526
88
4
0
88
0
4
0
Data
Capture %
47
45
47
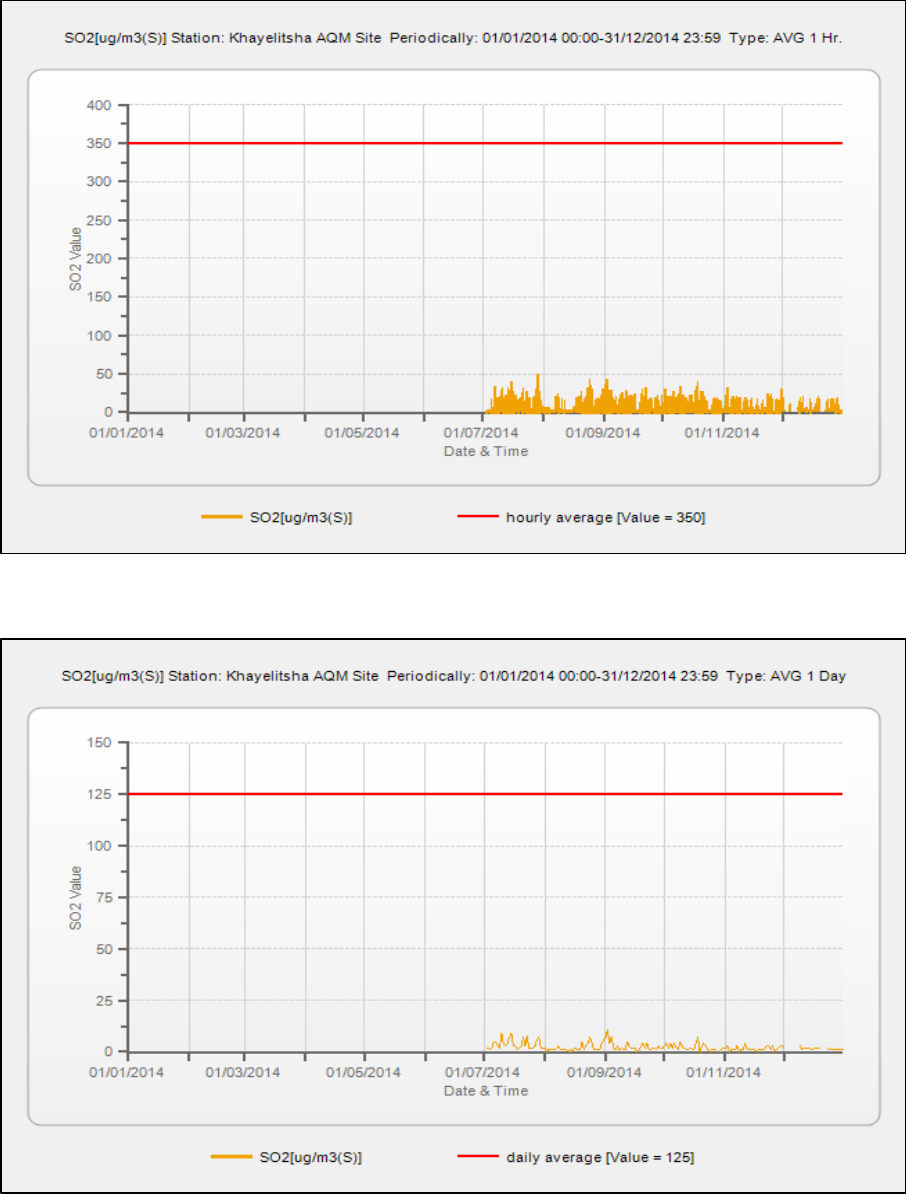
STATE OF AIR QUALITY MANAGEMENT: WESTERN CAPE 2014
74
Figure 1-84: Khayelitsha 1 - hourly average for SO
2
(1January 2014 – 31 December 2014)
Figure 1-85: Khayelitsha 24 - hour average for SO
2
(1January 2014 – 31 December 2014)
SO
2
for Khayelitsha did not exceed any of the SO
2
standards for the period 1 January 2014 – 31
December 2014. The annual average for SO
2
was 2µg/m³ for the period 1 January 2014 – 31 December
2014. The data capture for the period was 47%. The low data recovery is due to air conditioner
problems experienced during the period January – July 2014. The annual average must be viewed with
caution due to the low data recovery.
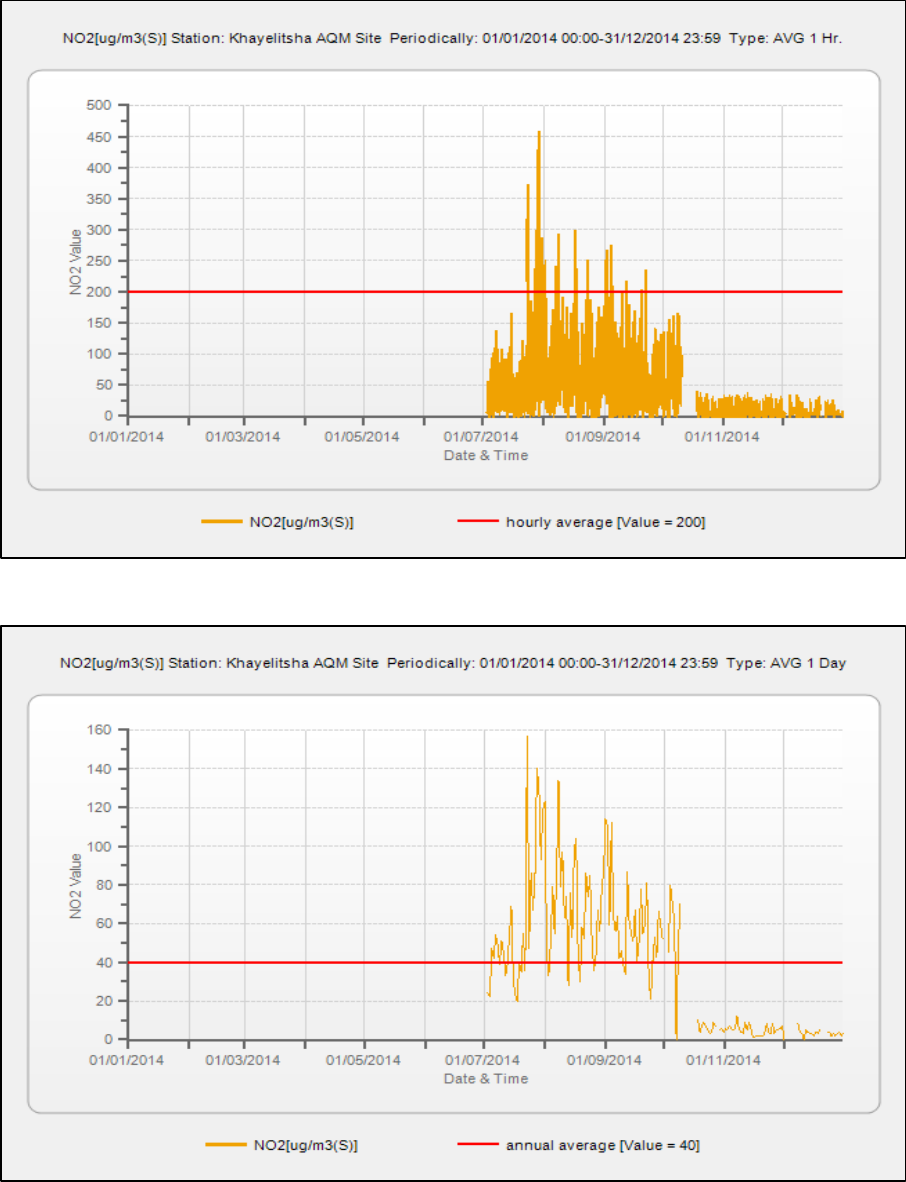
STATE OF AIR QUALITY MANAGEMENT: WESTERN CAPE 2014
75
Figure 1-86: Khayelitsha 1 - hourly average for NO
2
(1January 2014 – 31 December 2014)
Figure 1-87: Khayelitsha annual average for NO
2
(1January 2014 – 31 December 2014)
NO
2
for Khayelitsha exceeded the hourly average on 40 occasions for the period 1 January 2014 – 31
December 2014, with the highest hourly average of 441µg/m³ recorded on the 29 July 2014. The
exceedances can be attributed to vehicle emissons, as a result of a taxi rank in close proximity to the
site. The annual average for NO
2
was 39µg/m³ for the period 1 January 2014 – 31 December 2014. The
data capture for NO
2
was 45%. The low data recovery is due to air conditioner problems experienced
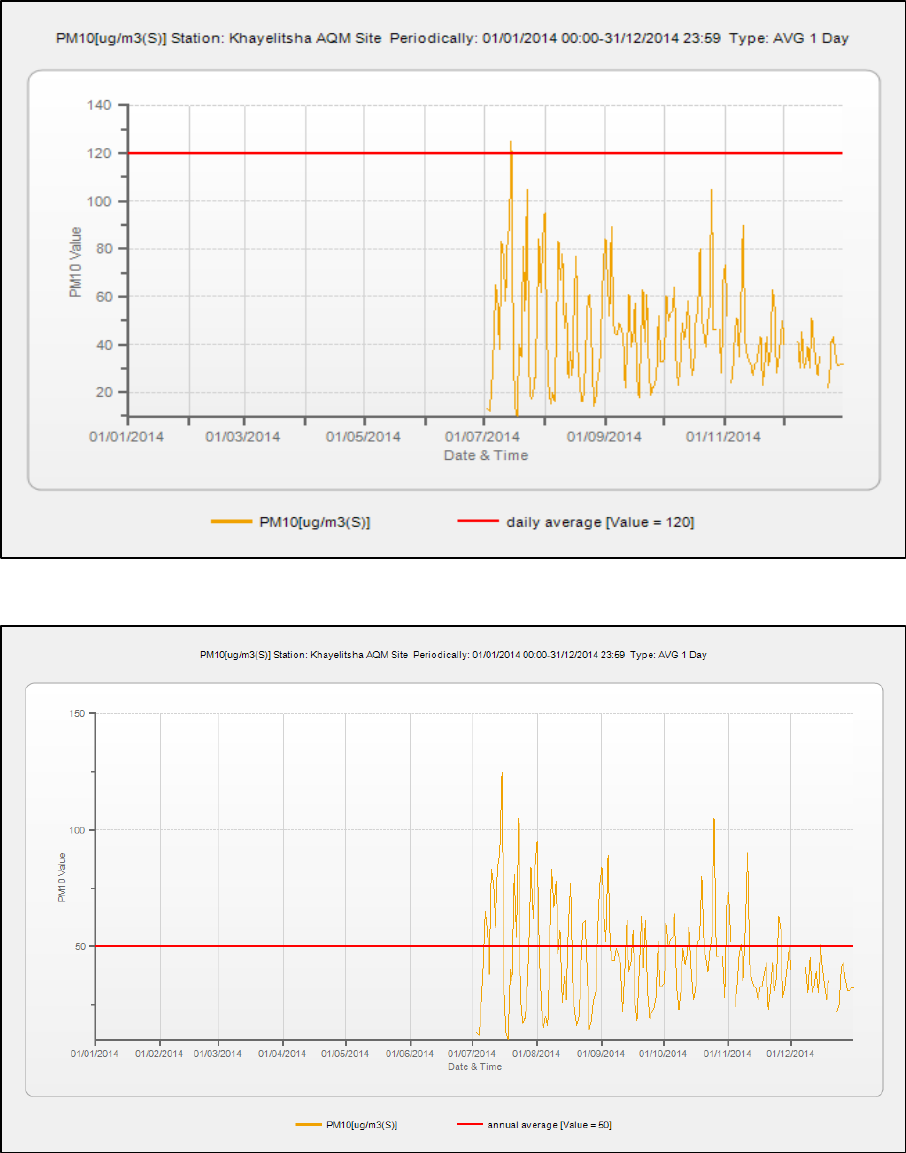
STATE OF AIR QUALITY MANAGEMENT: WESTERN CAPE 2014
76
during the period January – July 2014. The annual average must be viewed with caution due to the
low data recovery.
Figure 1-88: Khayelitsha 24 - hour average for PM
10
(January 2014 – 31 December 2014)
Figure 1-89: Khayelitsha annual average for PM
10
(January 2014 – 31 December 2014)
PM
10
for Khayelitsha exceeded the daily average on 1 occasion for the period 1 January 2014 – 31
December 2014, with the exceedence of 125µg/m³ recorded for 15 July 2015. The annual average for
PM
10
was 44µg/m³. The data capture for the period was 47%. The low data recovery is due to air
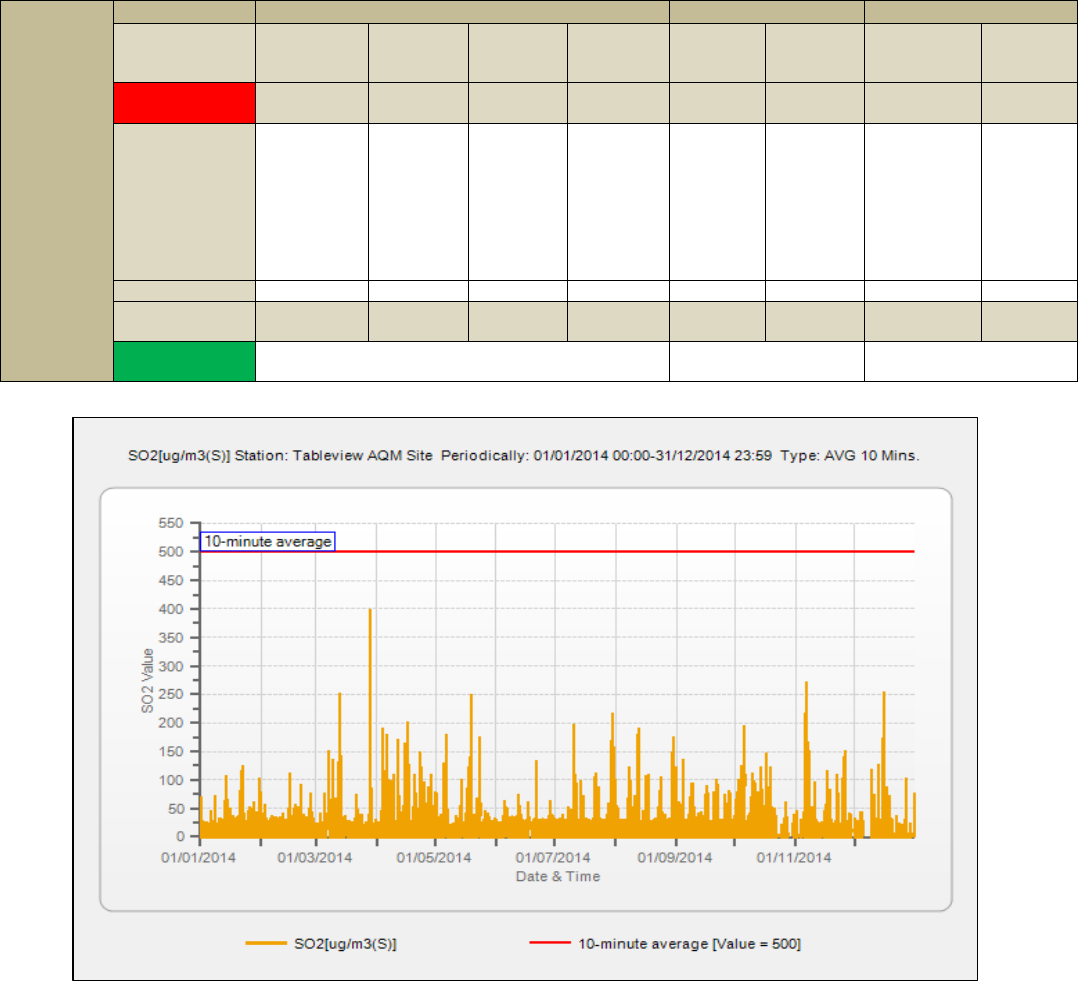
STATE OF AIR QUALITY MANAGEMENT: WESTERN CAPE 2014
77
conditioner problems experienced during the period January – July 2014. The annual average must be
viewed with caution due to the low data recovery.
1.2.5. Table View
The Table View monitoring station forms part of the Milnerton air quality monitoring network. The primary
aim of this monitoring network is to monitor the impact of the Chevron Refinery and other emitters from
the area, on ambient air quality.
Ambient monitoring at Tableview Monitoring Station commenced during 1994. The pollutants measured
are SO
2
, NOx and PM
10
. The analyses of the results are shown in Table 1-16, Figure 1-90, Figure 1-91,
Figure 1-92, Figure 1-93, Figure 1-94, Figure 1-95, Figure 1-96 and Figure 1-97.
Table 1-16: Tableview SO
2
, NO
2
and PM
10
Frequency of Exceedances and Data Recovery
(2014)
Tableview
Pollutant
SO
2
NO
2
PM
10
Averaging
Period
10 minute
average
1 hour
average
24 hour
daily
average
1 year
(annual
average)
1 hour
average
1 year
(annual
average)
24 hour
daily
average
1 year
(annual
average)
RSA AQ
Standard
500µg/m³
350µg/m³
125µg/m³
50µg/m³
200µg/m³
40µg/m³
120µg/m³
50µg/m³
Maximum/
Average
379µg/m³
(highest 10
minute
average
recorded
on the 28
March 2014
209µg/m³
(highest 1
hour
average
recorded
on the 28
Mar 2014
78µg/m³
(highest
daily
average
recorded
on the 30
July 2014
12µg/m³
(annual
average)
79µg/m³
(highest 1
hour
average
recorded
on the 4
Sep 2014
9µg/m³
(annual
average)
44µg/m³
(highest
daily
average
recorded
on the 23
July 2014
18µg/m³
(annual
average)
Exceedence
0
0
0
0
0
0
0
0
Frequency of
Exceedence
526
88
4
0
88
0
4
0
Data Capture
%
94
70
57
Figure 1-90: Tableview 10 – minute average for SO
2
(1January 2014 – 31 December 2014)
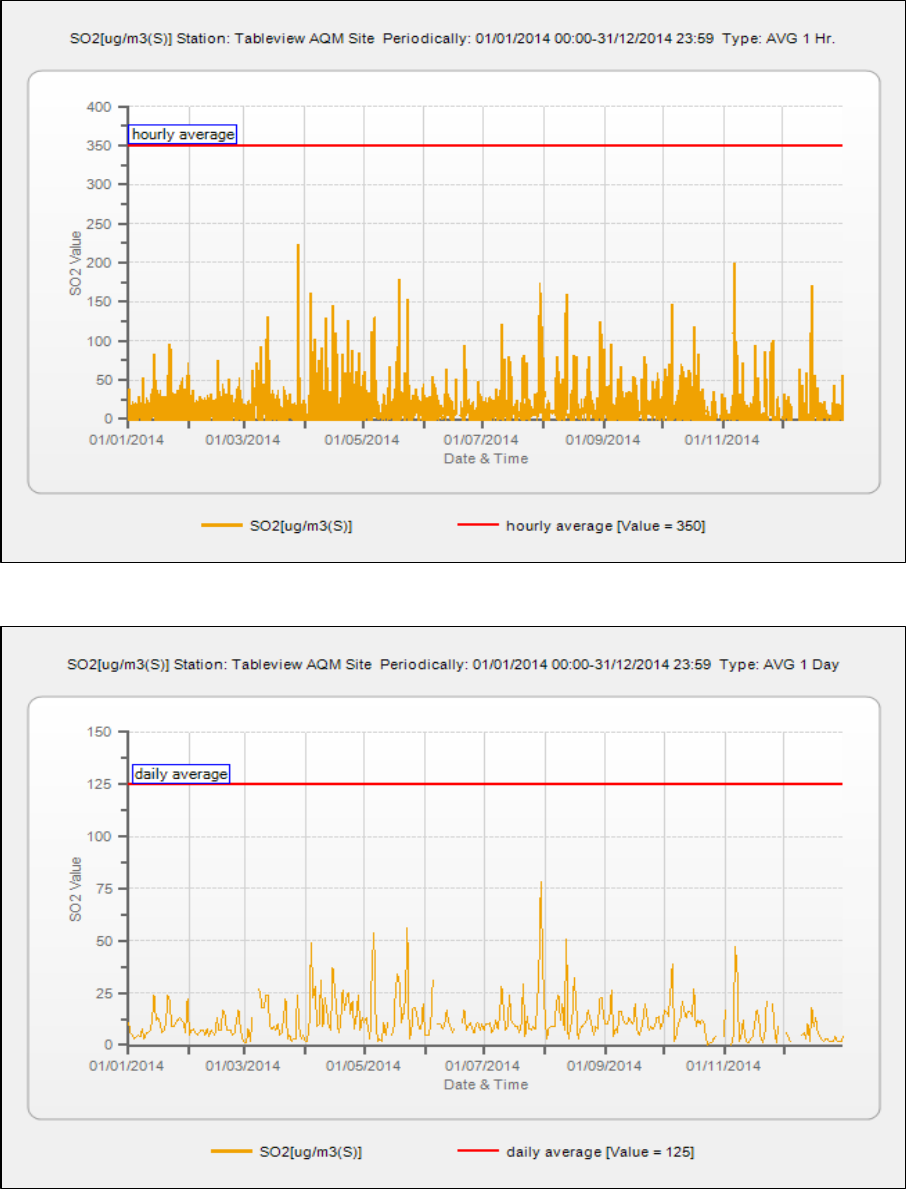
STATE OF AIR QUALITY MANAGEMENT: WESTERN CAPE 2014
78
Figure 1-91: Tableview 1 - hourly average for SO
2
(1January 2014 – 31 December 2014)
Figure 1-92: Tableview 24 - hour average for SO
2
(1January 2014 – 31 December 2014)
SO
2
for Tableview did not exceed any of the SO
2
standards for the period 1 January 2014 – 31
December 2014. The annual average for SO
2
was 12µg/m³ for the period 1 January 2014 – 31
December 2014. The data capture for the period was 94%.
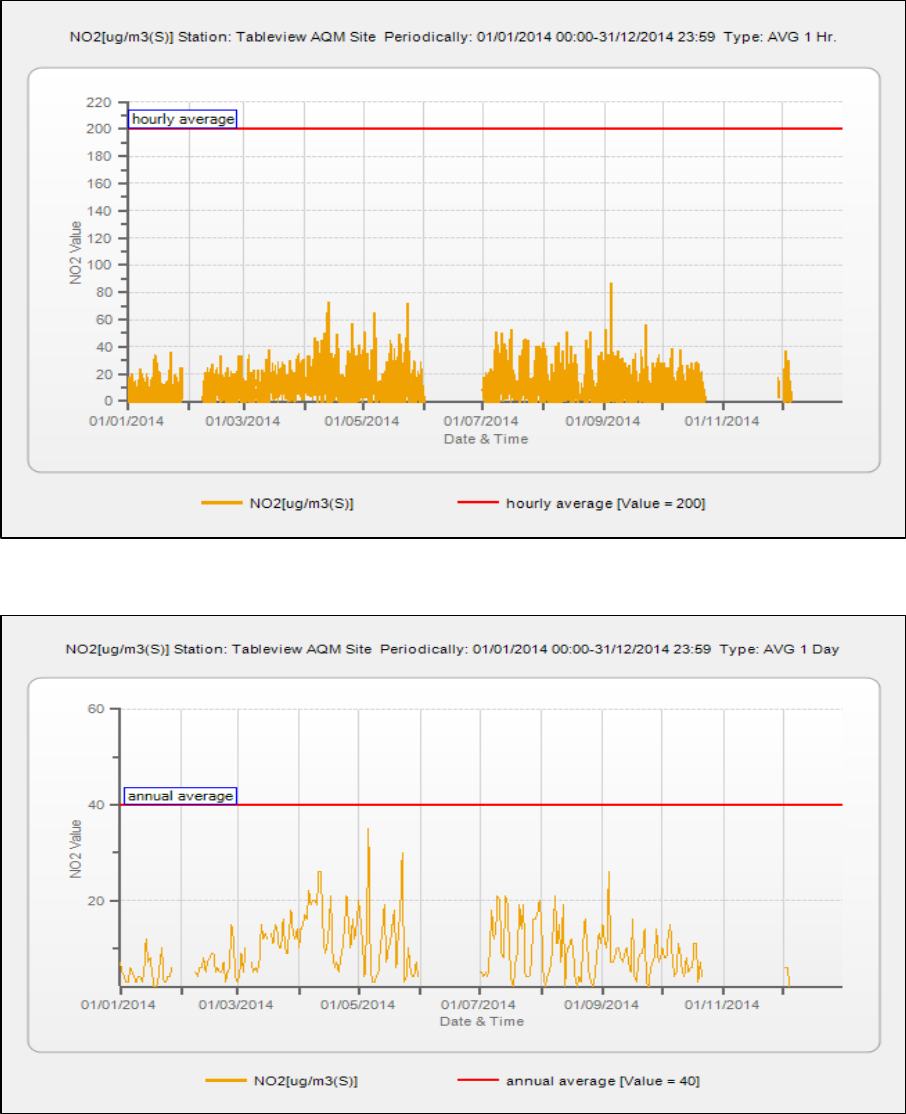
STATE OF AIR QUALITY MANAGEMENT: WESTERN CAPE 2014
79
Figure 1-93: Tableview 1 - hourly average for NO
2
(1January 2014 – 31 December 2014)
Figure 1-94: Tableview annual average for NO
2
(1January 2014 – 31 December 2014)
NO
2
for Tableview did not exceed any of the NO
2
standards for the period 1 January 2014 – 31
December 2014. The highest hourly average recorded for NO
2
was 79µg/m³ on the 04 September 2014.
The annual average for NO
2
was 9µg/m³ for the period 1 January 2014 – 31 December 2014. The data
capture for NO
2
was 70%.
The data loss for the period 28 January 2014 – 07 February 2014 was attributed to the analyser being
removed for calibrations. The data loss for the period 22 October 2014 – 28 November 2014 was due to
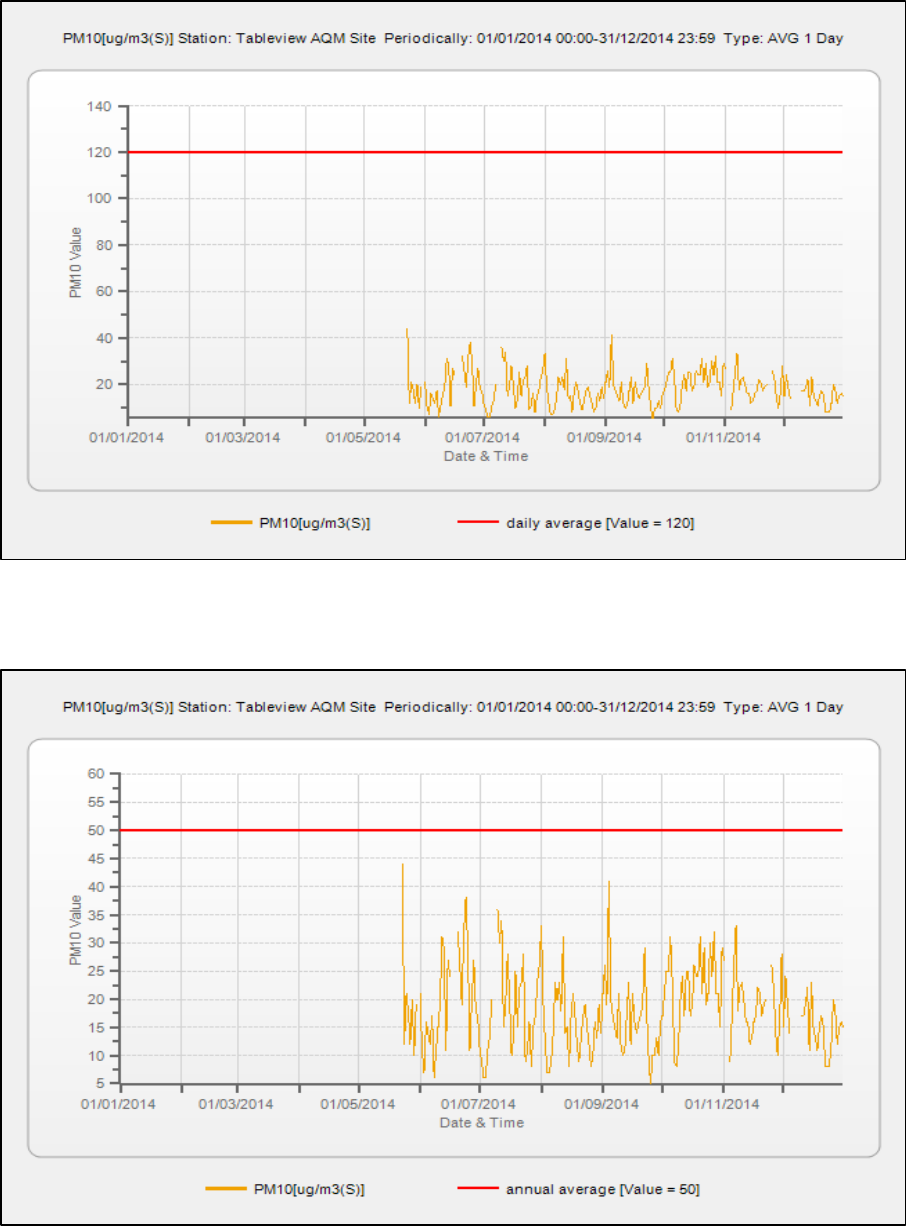
STATE OF AIR QUALITY MANAGEMENT: WESTERN CAPE 2014
80
analyser being removed for repairs. Further data loss was due to analyser malfunction and data was
deemed invalid.
Figure 1-95: Tableview 24 - hour average for PM
10
(1January 2014 – 31 December 2014)
Figure 1-96: Tableview annual average for PM
10
(1January 2014 – 31 December 2014)
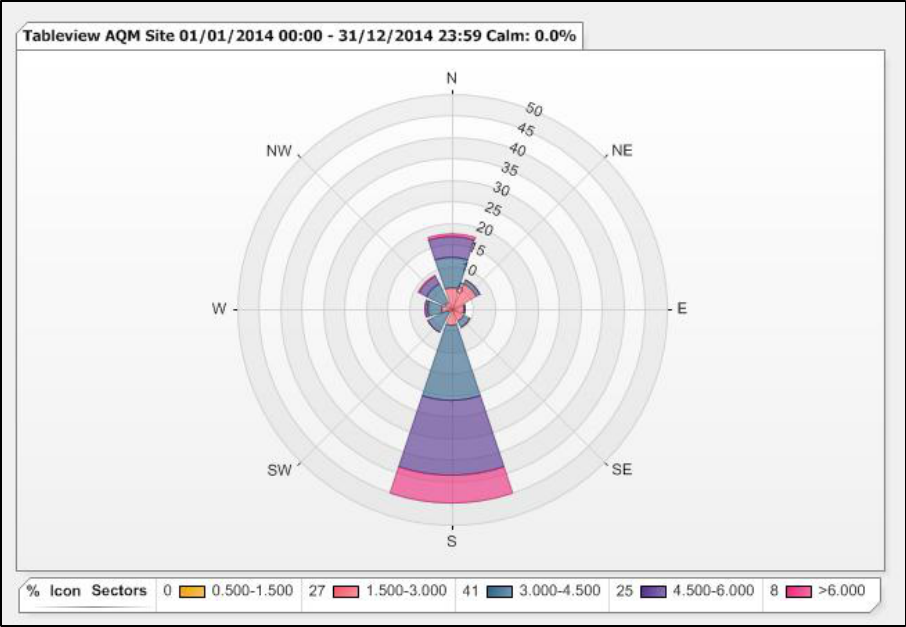
STATE OF AIR QUALITY MANAGEMENT: WESTERN CAPE 2014
81
The monitoring of Particulate Matter at Tableview commenced on the 14 May 2014. PM
10
for Tableview
did not exceed the daily and annual average for the period 1 January 2014 – 31 December 2014. The
highest 24 hour average for PM
10
was 44µg/m³ on the 23 May 2014. The annual average for PM
10
was
18µg/m³. The data capture for the period was 57%. The annual average must be viewed with caution
due to monitoring only commencing from May 2014.
Figure 1-97: Tableview annual wind rose (1January 2014 – 31 December 2014)
The meteorological conditions for the period were characterized by prevalent southerly winds in the
Tableview area.
1.2.6. Wallacedene
The Wallacedene monitoring station forms part of the City of Cape Town’s ambient air quality
monitoring network. The primary aim of this monitoring station is to monitor the impact emissions from
the Wallacedene informal settlement on ambient air quality.
Ambient monitoring at Wallacedene Monitoring Station commenced during 2006. The pollutants
measured are SO
2
, NO
x
and PM
10
. The analyses of the results are shown Table 1-17, Figure 1-98, Figure
1-99, Figure 1-100, Figure 1-101, Figure 1-102, Figure 1-103 and Figure 1-104.
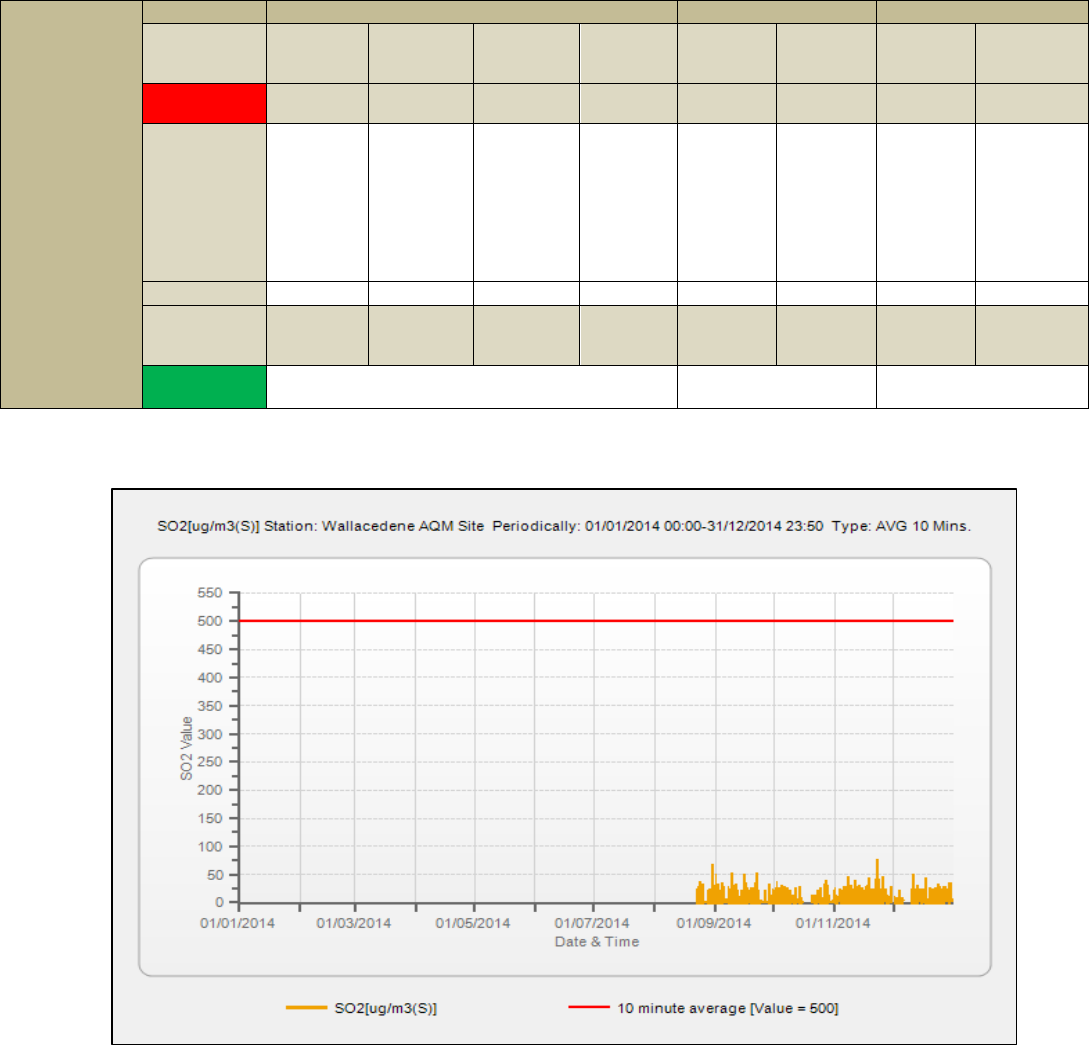
STATE OF AIR QUALITY MANAGEMENT: WESTERN CAPE 2014
82
Table 1-17: Wallacedene SO
2
, NO
2
and PM
10
Frequency of Exceedances and Data Recovery
(2014)
Figure 1-98: Wallacedene 10 – minute average for SO
2
(1January 2014 – 31 December 2014)
Wallacedene
Pollutant
SO
2
NO
2
PM
10
Averaging
Period
10 minute
average
1 hour
average
24 hour
daily
average
1 year
(annual
average)
1 hour
average
1 year
(annual
average)
24 hour
daily
average
1 year
(annual
average)
RSA AQ
Standard
500µg/m³
350µg/m³
125µg/m³
50µg/m³
200µg/m³
40µg/m³
120µg/m³
50µg/m³
Maximum /
Average
60µg/m³
(highest
10 minute
average
recorded
on the
04/08/201
4)
46µg/m³
(highest 1
hour
average
recorded
on the
22/11/201
4)
18µg/m³
(highest
daily
average
recorded
on the
22/11/201
4)
3µg/m³
(annual
average)
54µg/m³
(highest 1
hour
average
recorded
on the
07/10/201
4)
9µg/m³
(annual
average)
48µg/m³
(highest
daily
average
recorded
on the
01/08/201
4)
20 (annual
average)
Exceedence
0
0
0
0
0
0
0
0
Frequency
of
Exceedence
526
88
4
0
88
0
4
0
Data
Capture %
32
10
41
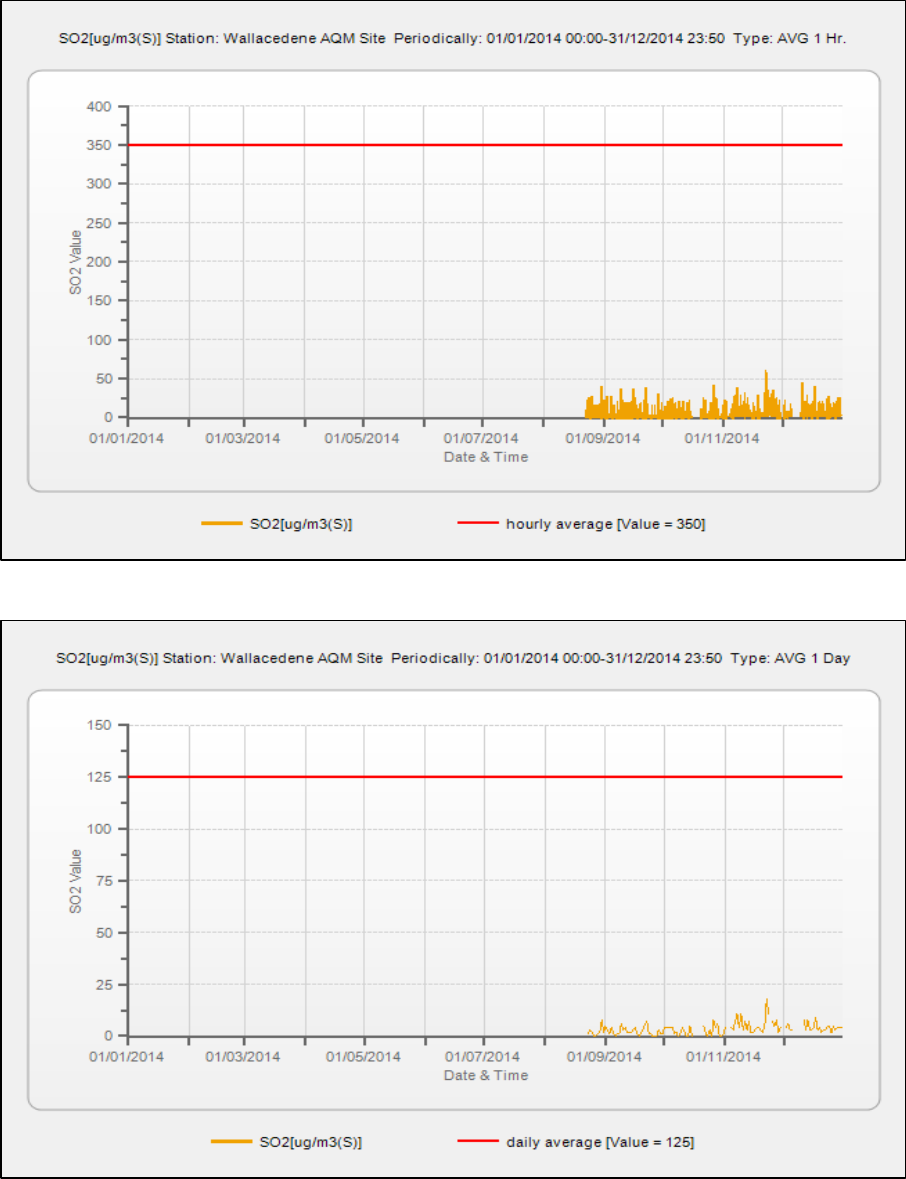
STATE OF AIR QUALITY MANAGEMENT: WESTERN CAPE 2014
83
Figure 1-99: Wallacedene 1 – hourly average for SO
2
(1January 2014 – 31 December 2014)
Figure 1-100: Wallacedene 24 – hour average for SO
2
(1January 2014 – 31 December 2014)
SO
2
for Wallacedene did not exceed any of the SO
2
standards for the period 1 January 2014 – 31
December 2014. The annual average for SO
2
was 3µg/m³ for the period 1 January 2014 – 31 December
2014. The data capture for the period was 32%. The low data recovery is due to air conditioner
problems experienced during the period January – July 2014. The annual average must be viewed with
caution due to the low data recovery.
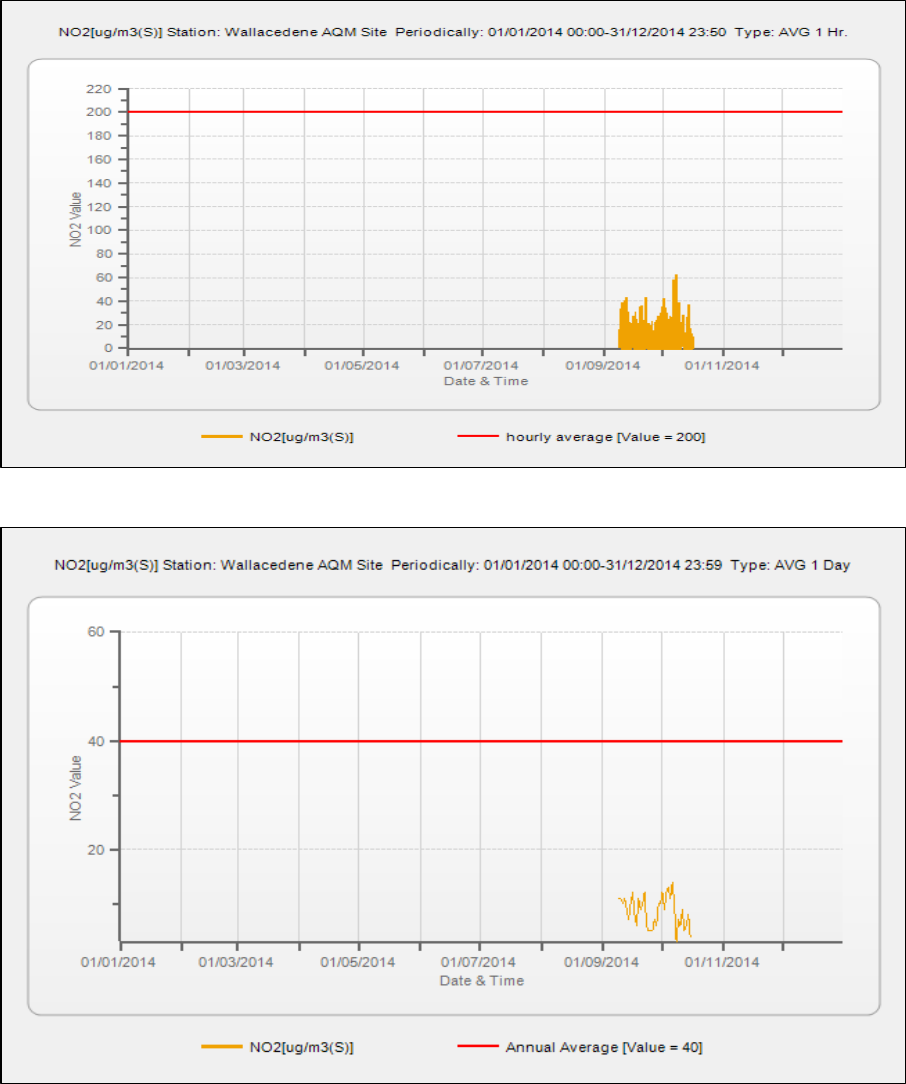
STATE OF AIR QUALITY MANAGEMENT: WESTERN CAPE 2014
84
Figure 1-101: Wallacedene 1 – hourly average for NO
2
(1January 2014 – 31 December 2014)
Figure 1-102: Wallacedene annual average for NO
2
(1January 2014 – 31 December 2014)
NO
2
for Wallacedene did not exceed any of the NO
2
standards for the period 1 January 2014 – 31
December 2014, with the highest hourly average of 54µg/m³ recorded on 07 October 2014. The annual
average for NO
2
was 9µg/m³ for the period 1 January 2014 – 31 December 2014. The data capture for
NO
2
was 10%. The low data recovery is due to air analyser malfunction and analyser being sent for
repairs. The annual average must be viewed with caution due to the low data recovery.
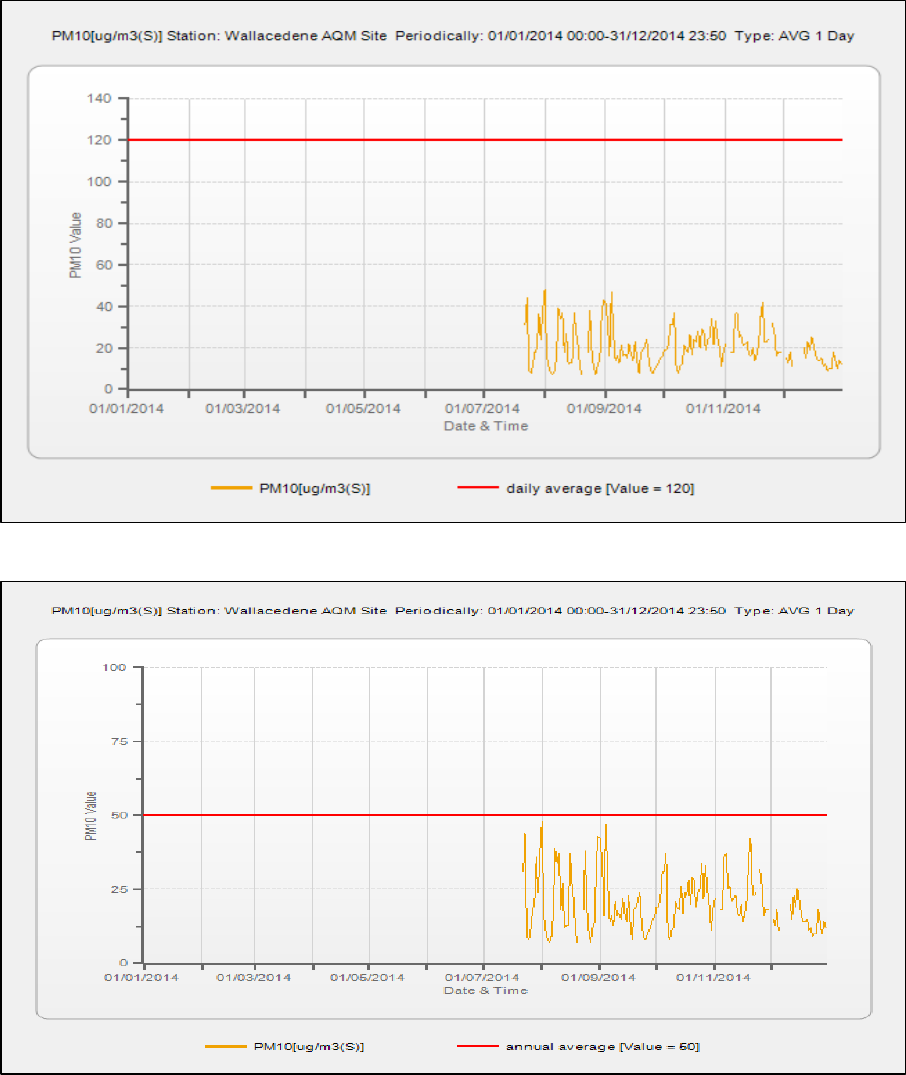
STATE OF AIR QUALITY MANAGEMENT: WESTERN CAPE 2014
85
Figure 1-103: Wallacedene 24 - hour average for PM
10
(1January 2014 – 31 December 2014)
Figure 1-104: Wallacedene annual average for PM
10
(1January 2014 – 31 December 2014)
PM
10
for Wallacedene did not exceed the daily and annual average for the period 1 January 2014 – 31
December 2014. The highest 24 hour average for PM
10
was 48µg/m³ on the 01 August 2014. The annual
average for PM
10
was 20µg/m³. The data capture for the period was 41%. The low data recovery is due
to air conditioner problems experienced during the period January – July 2014. The annual average
must be viewed with caution due to the low data recovery.
1.2.7. Plattekloof
The Plattekloof monitoring station is positioned to monitor the Chevron refinery’s impact on ambient air
quality. Ambient air quality monitoring at Plattekloof Monitoring Station commenced during late 2013.
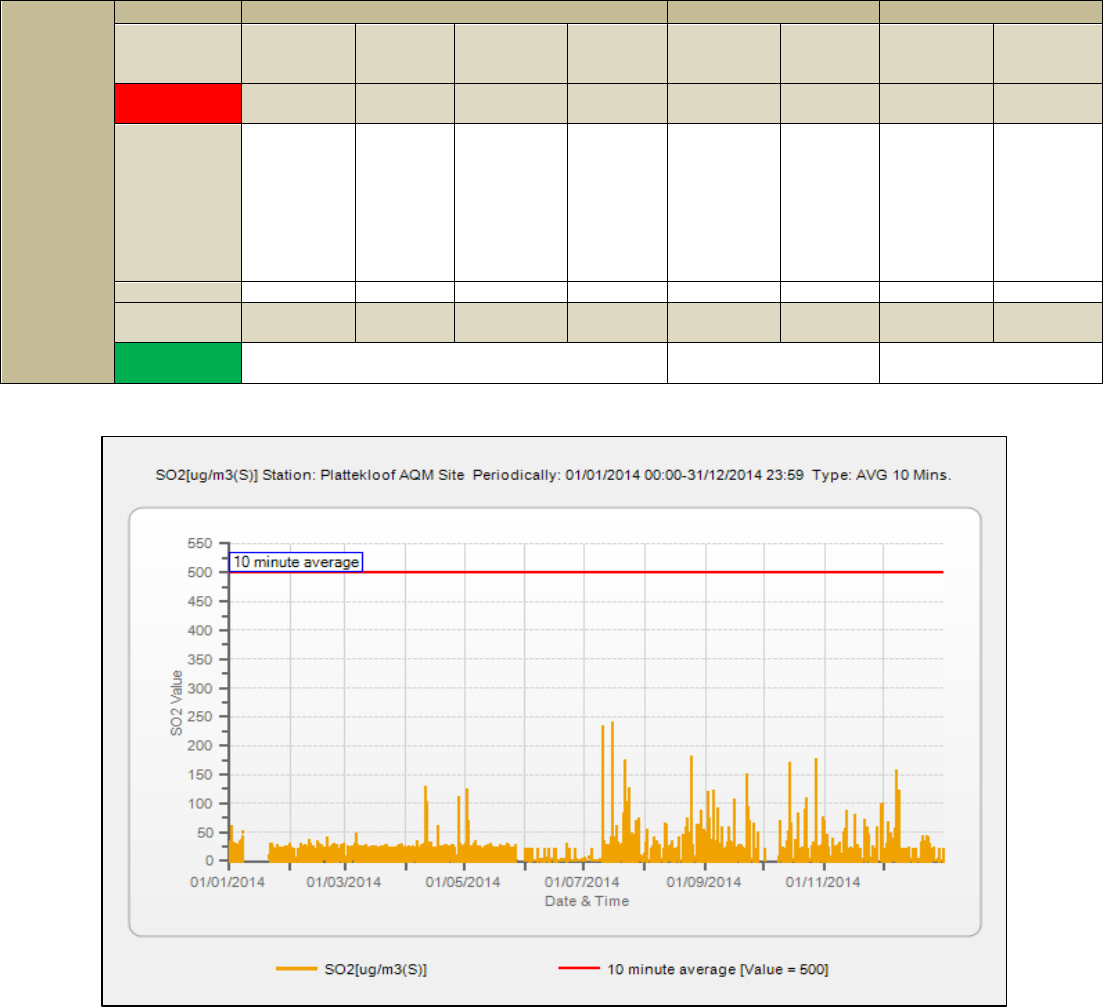
STATE OF AIR QUALITY MANAGEMENT: WESTERN CAPE 2014
86
The pollutants measured are SO
2
, NOx and PM
10
. The analyses of the results are shown in Table 1-18,
Figure 1-105, Figure 1-106, Figure 1-107, Figure 1-108, Figure 1-109, Figure 1-110and Figure 1-111
Table 1-18: Plattekloof SO
2
, NO
2
and PM
10
Frequency of Exceedances and Data Recovery
(2014)
Plattekloof
Pollutant
SO
2
NO
2
PM
10
Averaging
Period
10 minute
average
1 hour
average
24 hour
daily
average
1 year
(annual
average)
1 hour
average
1 year
(annual
average)
24 hour
daily
average
1 year
(annual
average)
RSA AQ
Standard
500µg/m³
350µg/m³
125µg/m³
50µg/m³
200µg/m³
40µg/m³
120µg/m³
50µg/m³
Maximum/
Average
222µg/m³
(highest 10
minute
average
recorded
on the
15/07/2014)
116µg/m³
(highest 1
hour
average
recorded
on the
15/07/201
4)
35µg/m³
(highest
daily
average
recorded
on the
15/07/2014)
4µg/m³
(annual
average)
127µg/m³
(highest 1
hour
average
recorded
on the
04/09/2014)
10µg/m³
(annual
average)
47µg/m³
(highest
daily
average
recorded
on the
27/10/2014)
22µg/m³
(annual
average)
Exceedence
0
0
0
0
0
0
0
0
Frequency of
Exceedence
526
88
4
0
88
0
4
0
Data
Capture %
90
46
28
Figure 1-105: Plattekloof 10 - minute average for SO
2
(1January 2014 – 31 December 2014)
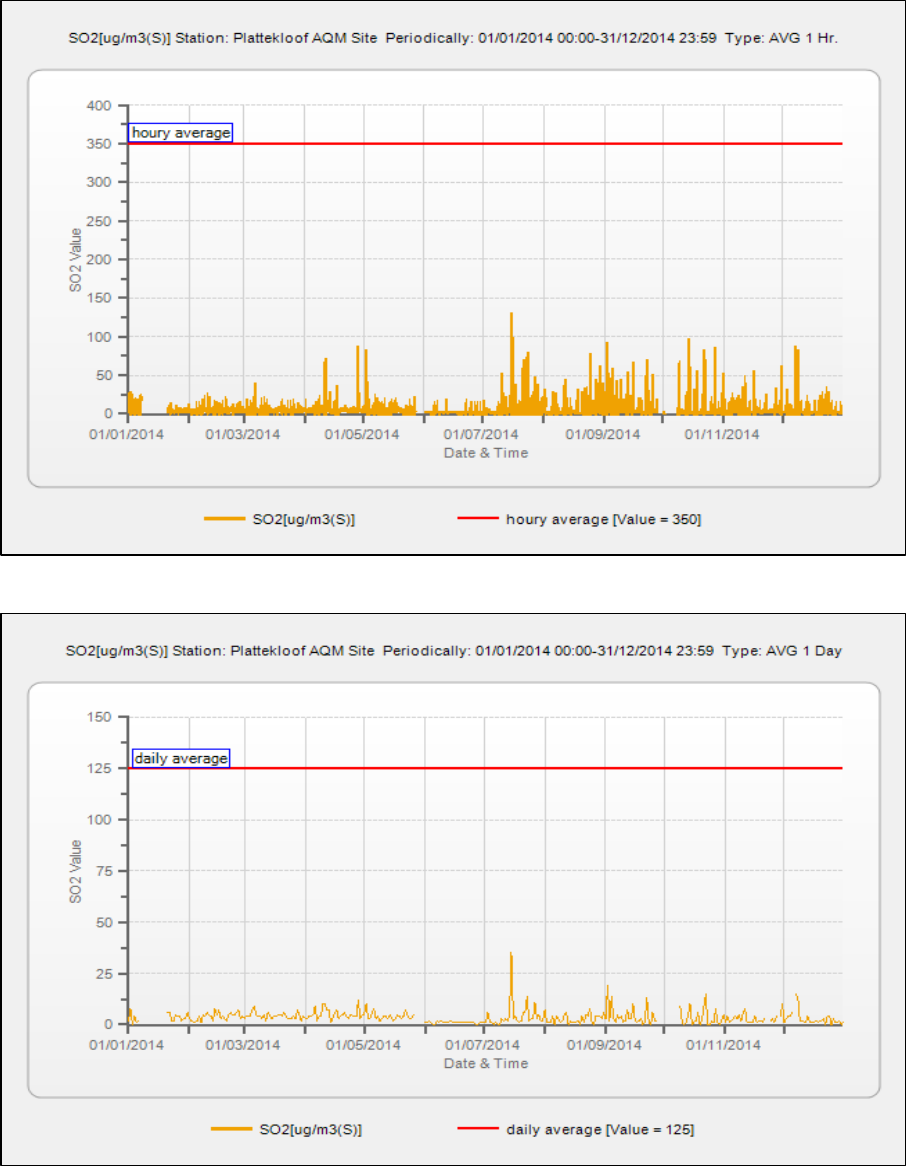
STATE OF AIR QUALITY MANAGEMENT: WESTERN CAPE 2014
87
Figure 1-106: Plattekloof 1 - hourly average for SO
2
(1January 2014 – 31 December 2014)
Figure 1-107: Plattekloof annual average for SO
2
(1January 2014 – 31 December 2014)
SO
2
for Plattekloof did not exceed any of the SO
2
standards for the period 1 January 2014 – 31
December 2014. The annual average for SO
2
was 4µg/m³ for the period 1 January 2014 – 31 December
2014. The data capture for the period was 90%. The gap in data from the 07 January 2014 – 20 January
was due to instrument malfunction.
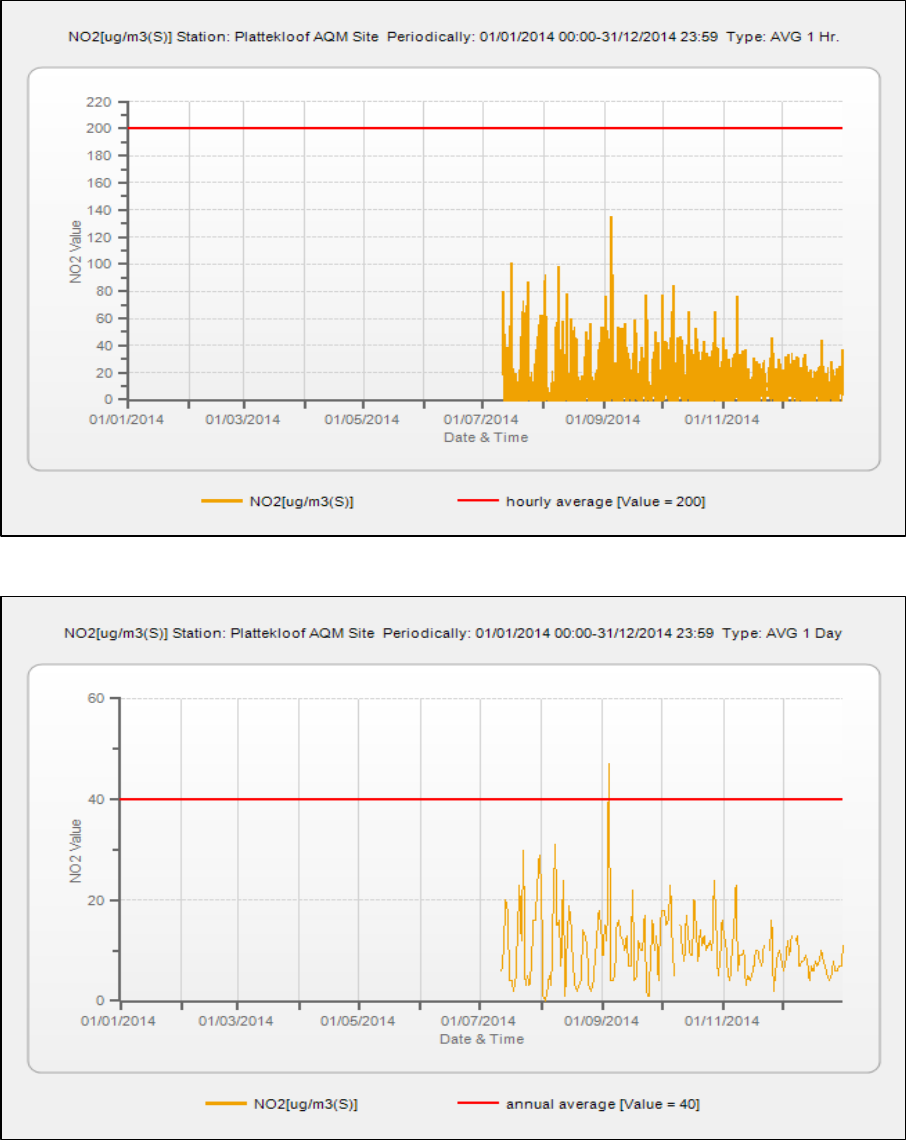
STATE OF AIR QUALITY MANAGEMENT: WESTERN CAPE 2014
88
Figure 1-108: Plattekloof 1 - hourly average for NO
2
(1January 2014 – 31 December 2014)
Figure 1-109: Plattekloof annual average for NO
2
(1January 2014 – 31 December 2014)
The monitoring of Oxides of Nitrogen (NO
x
) at Plattekloof commenced during July 2014. NO
2
for
Plattekloof did not exceed any of the NO
2
standards for the period 1 January 2014 – 31 December
2014. The highest hourly average recorded for NO
2
was 127µg/m³ on the 04 September 2014. The
annual average for NO
2
was 10µg/m³ for the period 1 January 2014 – 31 December 2014. The data
capture for NO
2
was 46%.
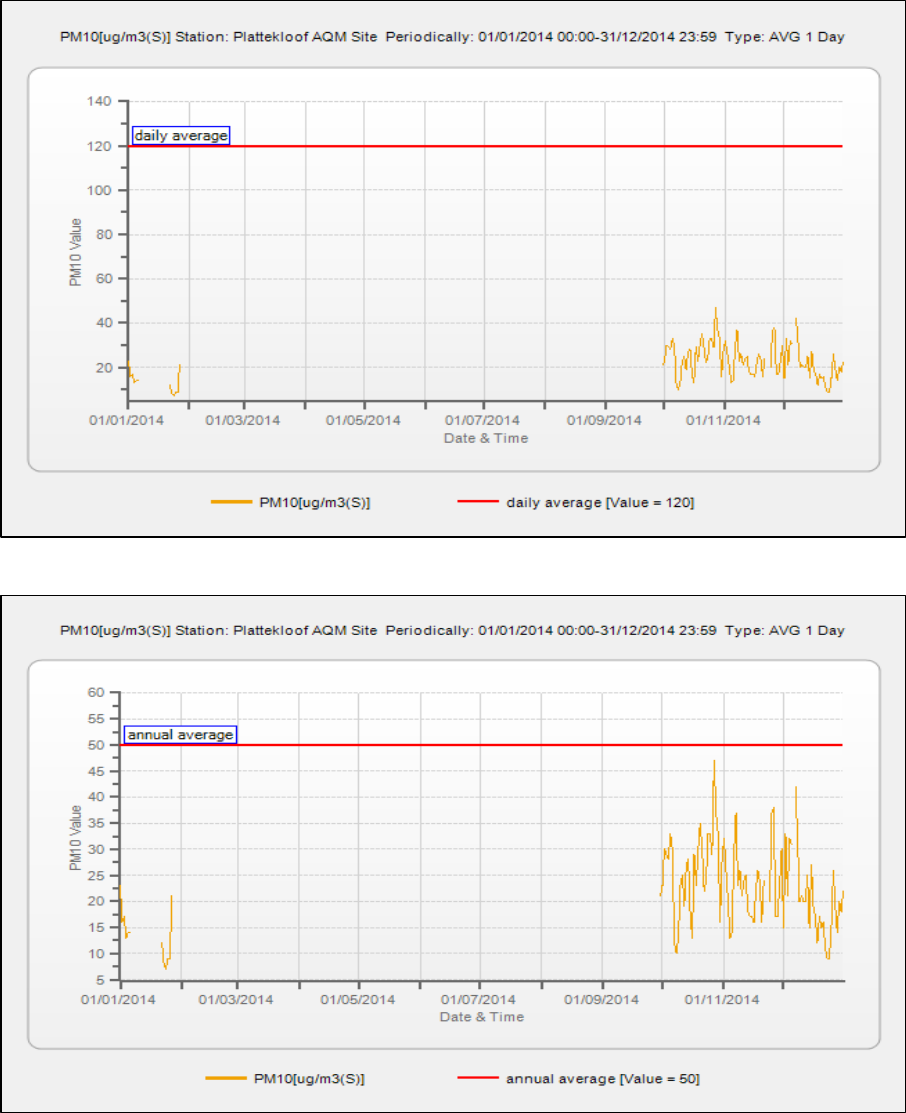
STATE OF AIR QUALITY MANAGEMENT: WESTERN CAPE 2014
89
Figure 1-110: Plattekloof 24 - hour average for PM
10
(1January 2014 – 31 December 2014)
Figure 1-111: Plattekloof annual average for PM
10
(1January 2014 – 31 December 2014)
PM
10
for Plattekloof did not exceed the daily and annual average for the period 1 January 2014 – 31
December 2014. The highest 24 hour average for PM
10
was 47µg/m³ on the 27 October 2014. The
annual average for PM
10
was 22µg/m³. The data capture for the period was 28% due to TEOM being
removed for repairs. The daily and annual average must be viewed with caution due to the low data
recovery.
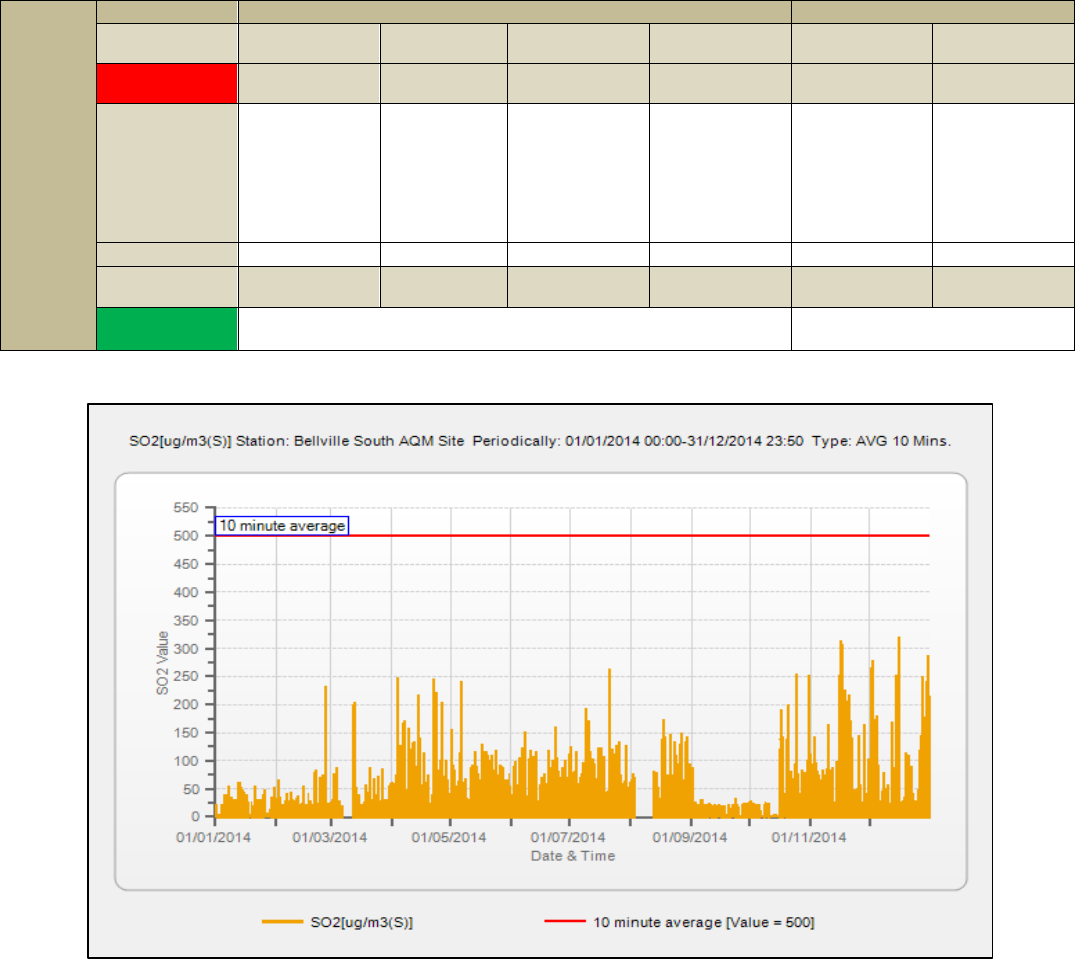
STATE OF AIR QUALITY MANAGEMENT: WESTERN CAPE 2014
90
1.2.8. Bellville-South
Ambient air quality monitoring at the Bellville monitoring station commenced during 2003. The
pollutants measured are SO
2
and PM
10
. The analyses of the results are shown in Table 1-19, Figure 1-112,
Figure 1-113, Figure 1-114, Figure 1-115 and Figure 1-116.
Table 1-19: Bellville-South SO
2
and PM
10
Frequency of Exceedeances and Data Recovery (2014)
Figure 1-112: Bellville-South 10 - minute average for SO
2
(1January 2014 – 31 December 2014)
Bellville
South
Pollutant
SO
2
PM
10
Averaging
Period
10 minute
average
1 hour
average
24 hour daily
average
1 year (annual
average)
24 hour daily
average
1 year (annual
average)
RSA AQ
Standard
500µg/m³
350µg/m³
125µg/m³
50µg/m³
120µg/m³
50µg/m³
Maximum /
Average
300µg/m³
(highest 10
minute
average
recorded on
the
15/12/2014)
252µg/m³
(highest 1
hour
average
recorded on
the
15/12/2014)
95µg/m³
(highest daily
average
recorded on
the
02/12/2014)
11µg/m³
(annual
average)
54µg/m³
(highest daily
average
recorded on
the
14/04/2014)
25µg/m³
(annual
average)
Exceedence
0
0
0
0
0
0
Frequency of
Exceedence
526
88
4
0
4
0
Data Capture
%
95
52
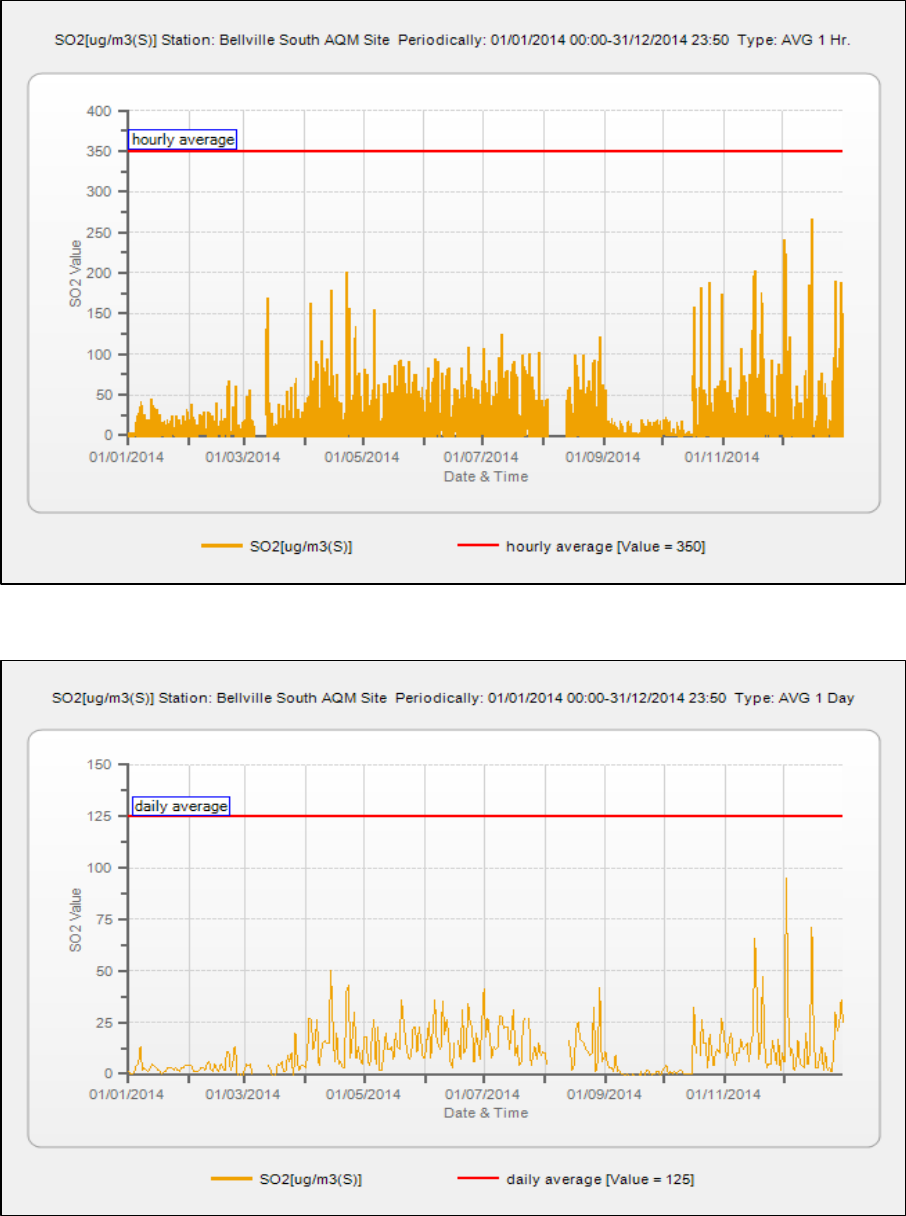
STATE OF AIR QUALITY MANAGEMENT: WESTERN CAPE 2014
91
Figure 1-113: Bellville-South 1 - hourly average for SO
2
(1January 2014 – 31 December 2014)
Figure 1-114: Bellville-South 24 - hour average for SO
2
(1January 2014 – 31 December 2014)
SO
2
for Bellville South did not exceed any of the SO
2
standards for the period 1 January 2014 – 31
December 2014. The annual average for SO
2
was 11µg/m³ for the period 1 January 2014 – 31
December 2014. The data capture for the period was 95%. The gaps in data were due to power
outages in the area.
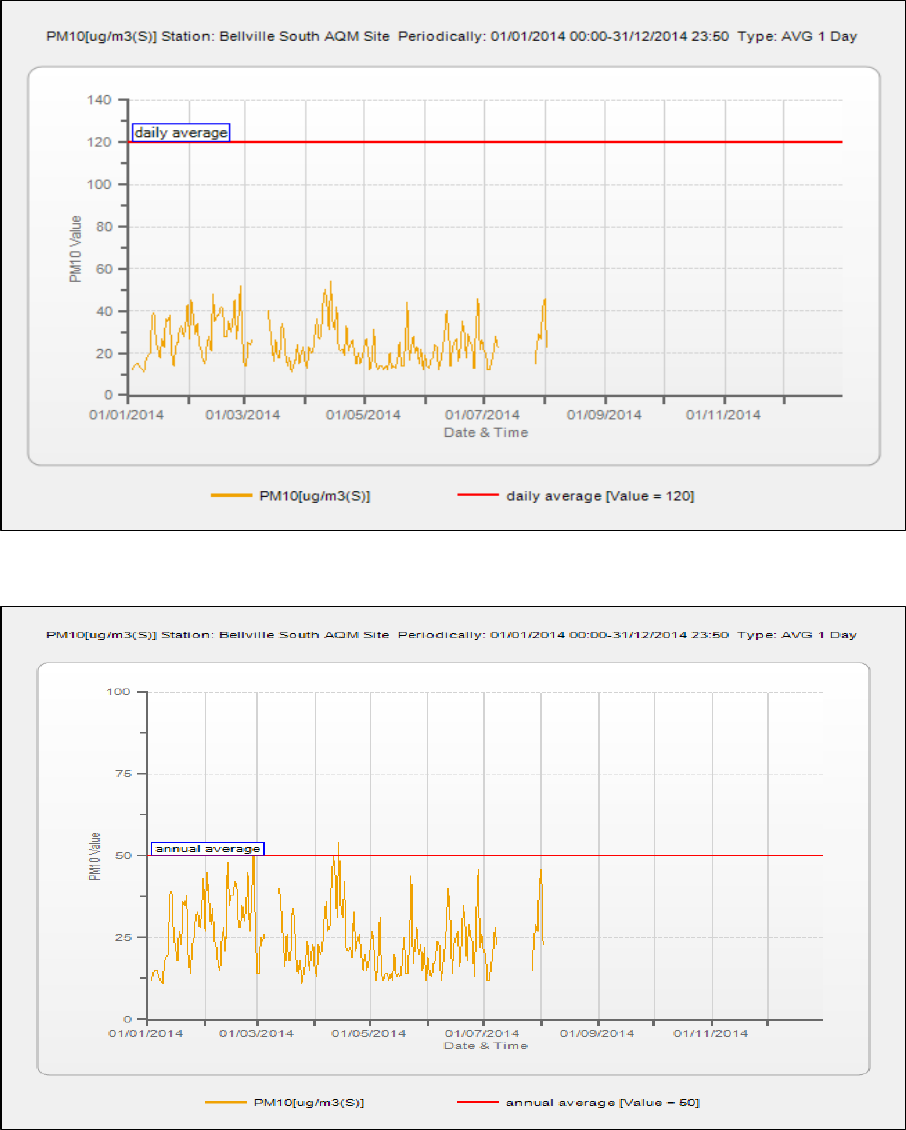
STATE OF AIR QUALITY MANAGEMENT: WESTERN CAPE 2014
92
Figure 1-115: Bellville-South 24 - hour average for PM
10
(1January 2014 – 31 December 2014)
Figure 1-116: Bellville-South annual average for PM
10
(1January 2014 – 31 December 2014)
PM
10
for Bellville South did not exceed the daily and annual average for the period 1 January 2014 – 31
December 2014. The highest 24 hour average for PM
10
was 54µg/m³ on the 14 April 2014. The annual
average for PM
10
was 25µg/m³. The data capture for the period was 52%. The low data recovery is due
to power outages at the site, resulting in damage to the TEOM analyser. The annual average must be
viewed with caution due to the low data recovery.
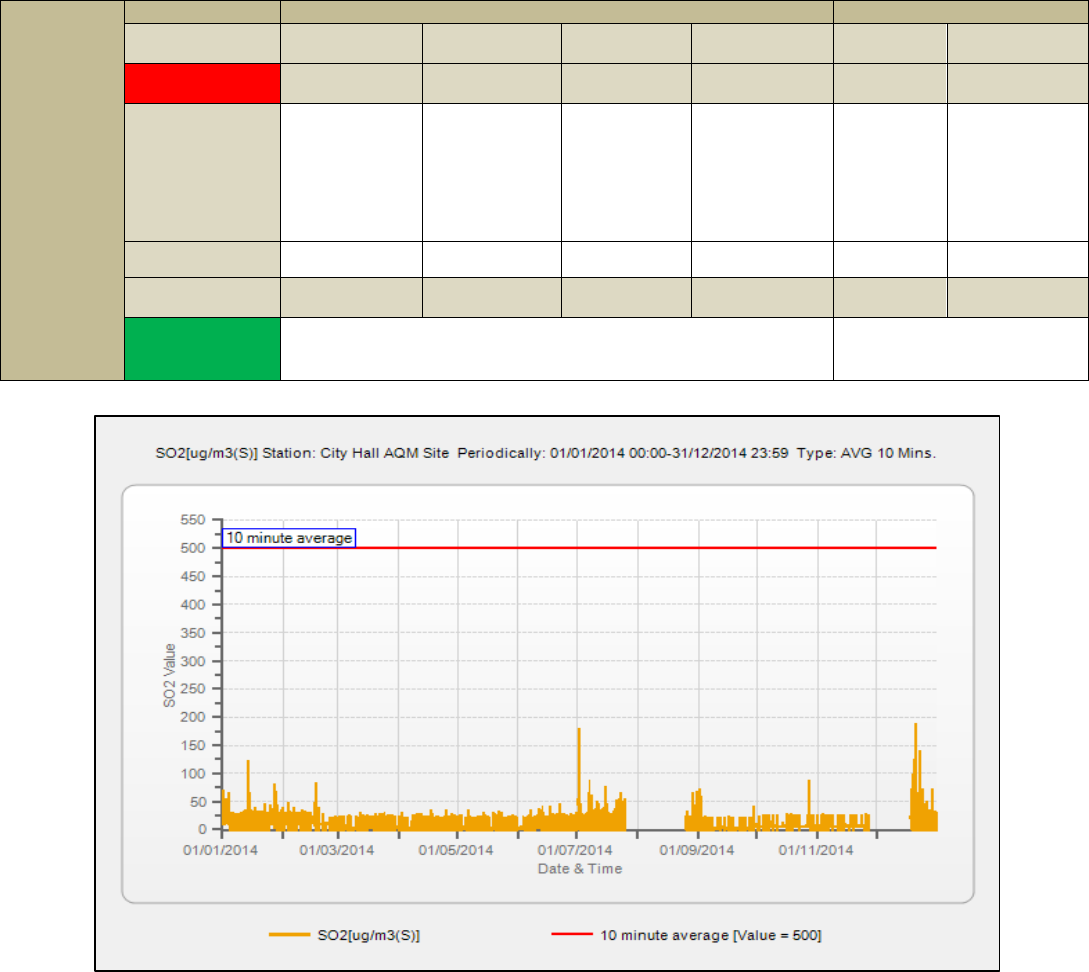
STATE OF AIR QUALITY MANAGEMENT: WESTERN CAPE 2014
93
1.2.9. City Hall
Ambient monitoring at City Hall Monitoring Station commenced during 1994. The pollutants measured
are SO
2
, NOx and CO. The analyses of the results are shown in Table 1-20, Figure 1-117, Figure 1-118,
Figure 1-119, Figure 1-120 and Figure 1-121.
Table 1-20: City Hall SO
2
NOx and CO Frequency of Exceedances and Data Recovery (2014)
City Hall
Pollutant
SO
2
NO
2
Averaging
Period
10 minute
average
1 hour
average
24 hour daily
average
1 year (annual
average)
1 hour
average
1 year (annual
average)
RSA AQ
Standard
500µg/m³
350µg/m³
125µg/m³
50µg/m³
200µg/m³
40µg/m³
Maximum /
Average
168µg/m³
(highest 10
minute
average
recorded on
the
20/12/2014)
141µg/m³
(highest 1 hour
average
recorded on
the
20/12/2014)
36µg/m³
(highest daily
average
recorded on
the
20/12/2014)
6µg/m³
(annual
average)
76µg/m³
(highest 1
hour
average
recorded
on the
06/10/2014)
19µg/m³
(annual
average)
Exceedence
0
0
0
0
0
0
Frequency of
Exceedence
526
88
4
0
88
0
Data Capture %
85
53
Figure 1-117: City Hall 10 - minute average for SO
2
(1January 2014 – 31 December 2014)
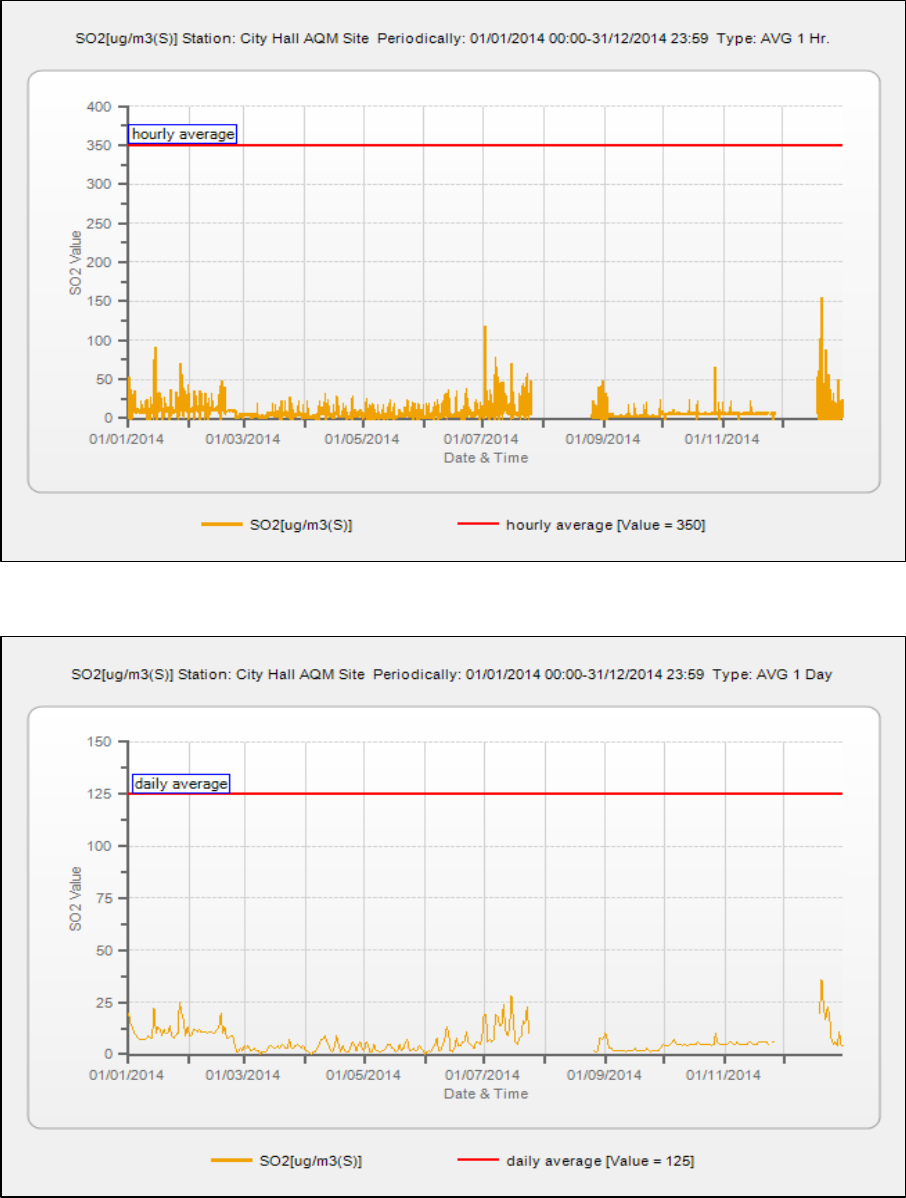
STATE OF AIR QUALITY MANAGEMENT: WESTERN CAPE 2014
94
Figure 1-118: City Hall 1 – hourly average for SO
2
(1January 2014 – 31 December 2014)
Figure 1-119: City Hall 24 – hour average for SO
2
(1January 2014 – 31 December 2014)
SO
2
for City Hall did not exceed any of the SO
2
standards for the period 1 January 2014 – 31 December
2014. The annual average for SO
2
was 6µg/m³ for the period 1 January 2014 – 31 December 2014. The
data capture for the period was 85%. The gaps in the data are due to the analyser being removed for
calibrations for the period 25 July 2014 – 25 August 2014 and 27 November 2014 – 18 December 2014.
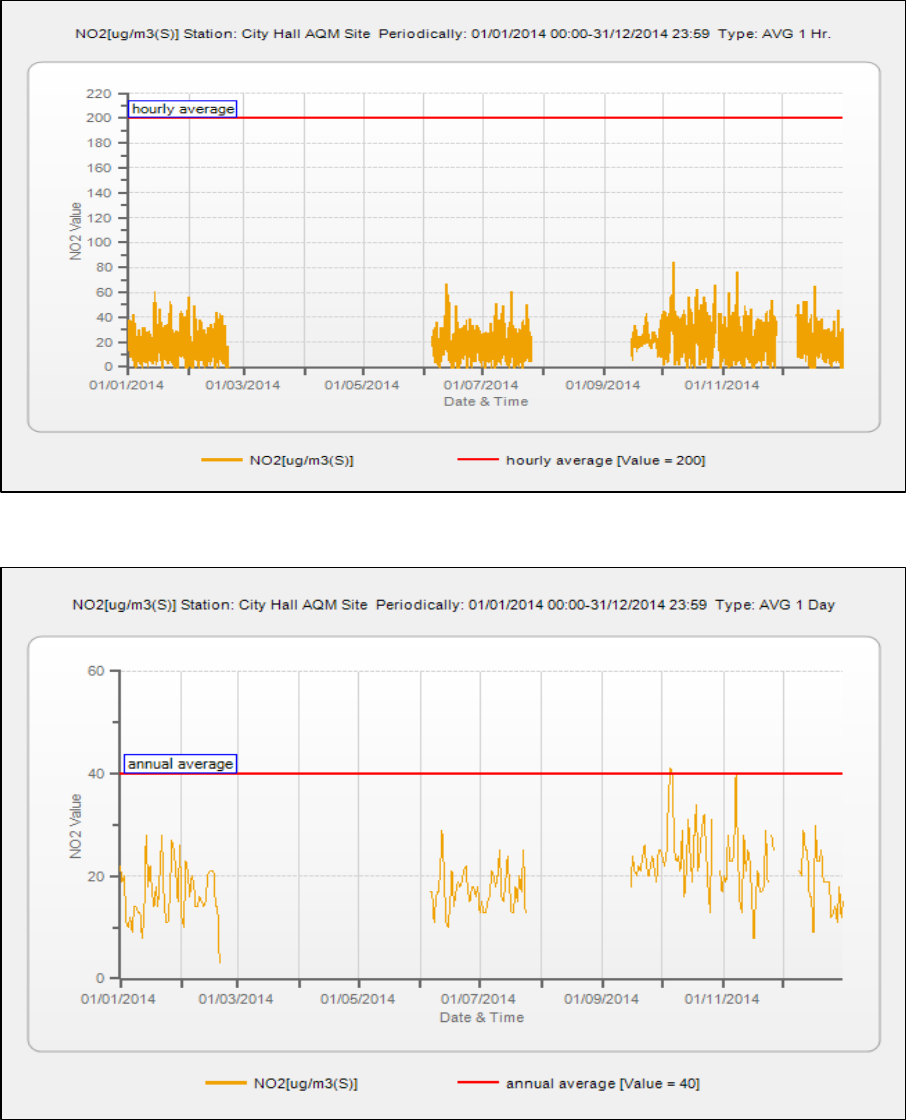
STATE OF AIR QUALITY MANAGEMENT: WESTERN CAPE 2014
95
Figure 1-120: City Hall 1 – hourly average for NO
2
(1January 2014 – 31 December 2014)
Figure 1-121: City Hall annual average for NO
2
(1January 2014 – 31 December 2014)
NO
2
for City Hall did not exceed any of the NO
2
standards for the period 1 January 2014 – 31
December 2014, with the highest hourly average of 76µg/m³ recorded on the 06 October 2014. The
annual average for NO
2
was 19µg/m³ for the period 1 January 2014 – 31 December 2014. The data
capture for NO
2
was 53%. The low data recovery is due to air conditioner malfunction and analyser
removal for calibration purposes. The annual average must be viewed with caution due to the low
data recovery.
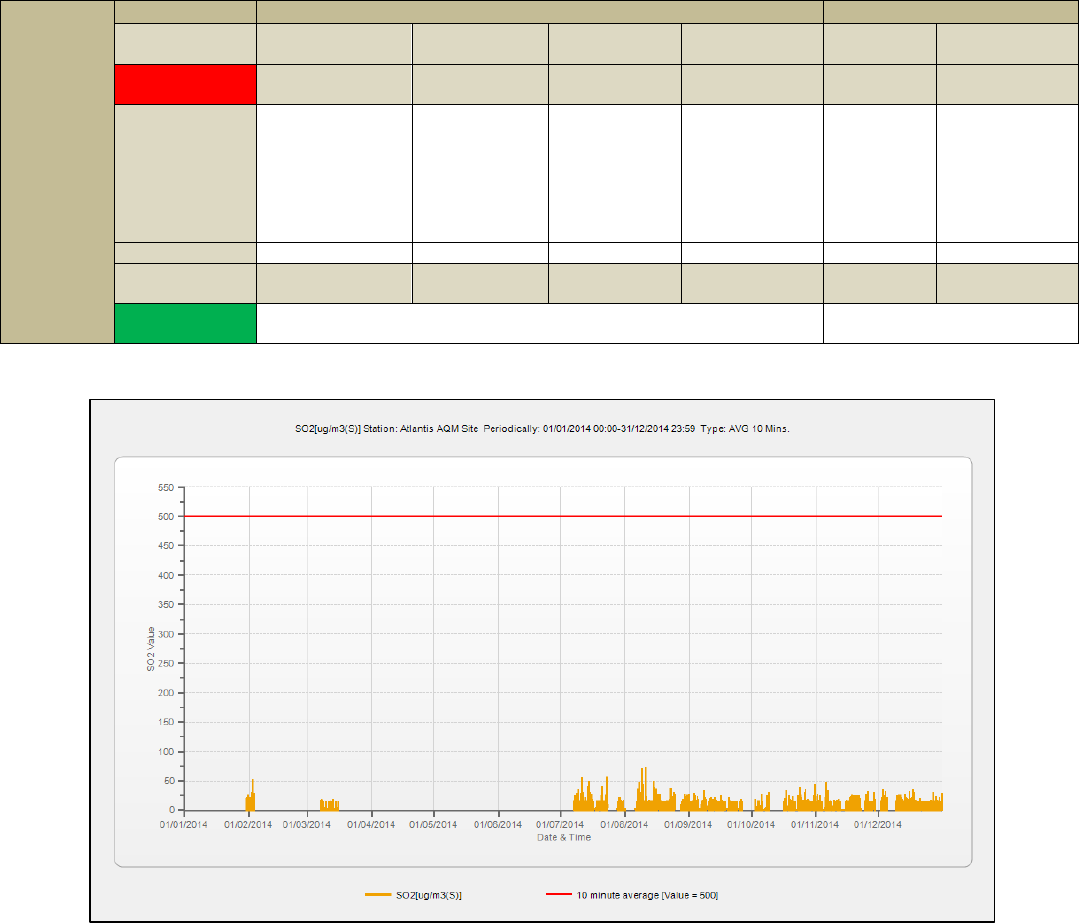
STATE OF AIR QUALITY MANAGEMENT: WESTERN CAPE 2014
96
1.2.10. Atlantis
Ambient monitoring at Atlantis Monitoring Station commenced in 2008. The pollutants measured are
SO
2
, and NOx. The analyses of the results are shown in Table 1-21, Figure 1-122, Figure 1-123, Figure
1-124, Figure 1-125, Figure 1-126 and Figure 1-127.
Table 1-21: Atlantis SO
2
and NOx Frequency of Exceedances and Data Recovery (2014)
Atlantis
Pollutant
SO
2
NO
2
Averaging
Period
10 minute
average
1 hour
average
24 hour daily
average
1 year (annual
average)
1 hour
average
1 year (annual
average)
RSA AQ
Standard
500µg/m³
350µg/m³
125µg/m³
50µg/m³
200µg/m³
40µg/m³
Maximum/
Average
60µg/m³ (highest
10 minute
average
recorded on the
11/08/2014)
44µg/m³
(highest 1 hour
average
recorded on
the
11/08/2014)
9µg/m³
(highest daily
average
recorded on
the
09/08/2014)
2µg/m³
(annual
average)
130µg/m³
(highest 1
hour
average
recorded
on the
08/07/2015
4µg/m³
(annual
average)
Exceedence
0
0
0
0
0
0
Frequency of
Exceedence
526
88
4
0
88
0
Data Capture
%
41
45
Figure 1-122: Atlantis 10 - minute average for SO
2
(1January 2014 – 31 December 2014)
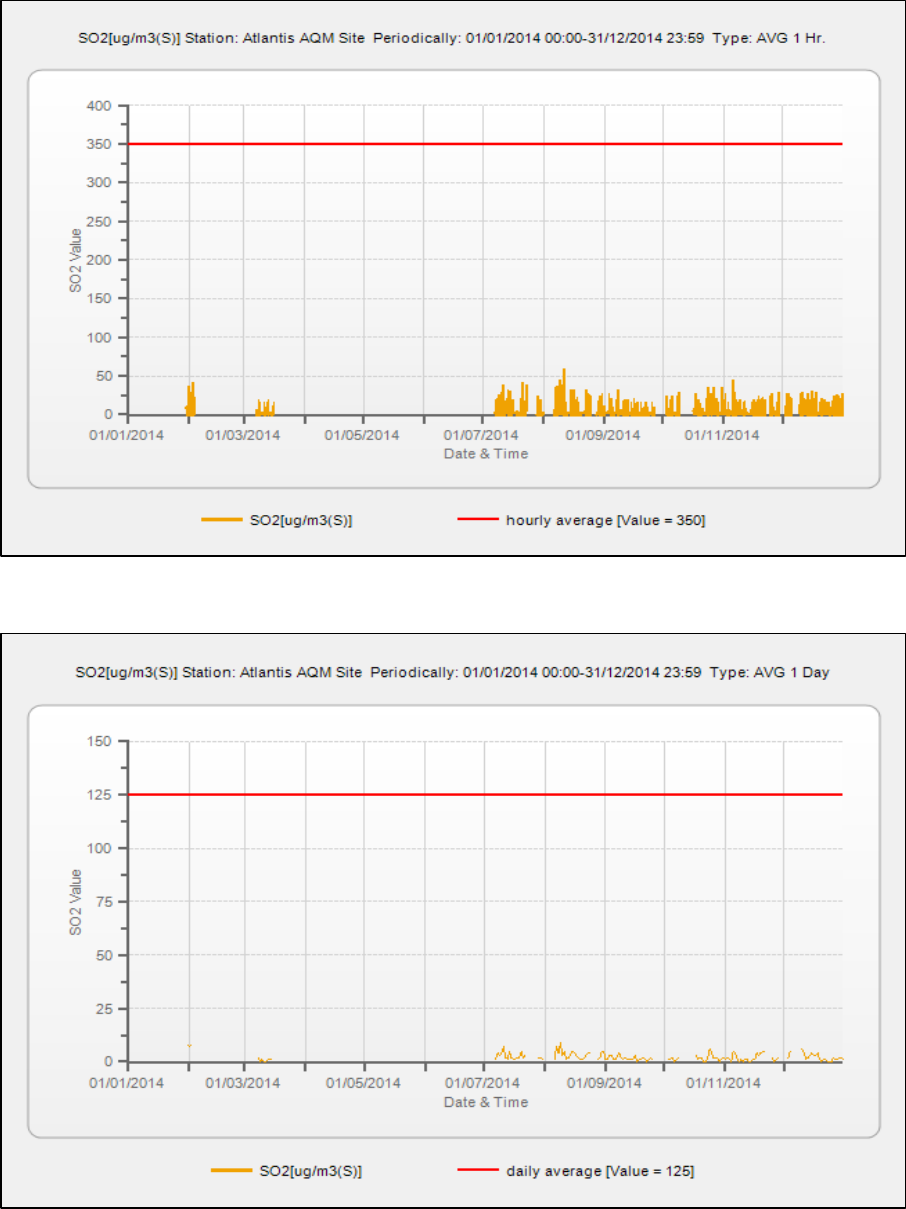
STATE OF AIR QUALITY MANAGEMENT: WESTERN CAPE 2014
97
Figure 1-123: Atlantis 1 - hourly average for SO
2
(1January 2014 – 31 December 2014)
Figure 1-124: Atlantis 24 - hour average for SO
2
(1January 2014 – 31 December 2014)
SO
2
for Atlantis did not exceed any of the SO
2
standards for the period 1 January 2014 – 31 December
2014, with highest 10 minute and hourly average recorded on the 11 August 2014. The annual average
for SO
2
was 2µg/m³ for the period 1 January 2014 – 31 December 2014. The data capture for the period
was 41%. The low data recovery is due to air conditioner problems experienced during the period
January – July 2014. The annual average must be viewed with caution due to the low data recovery.
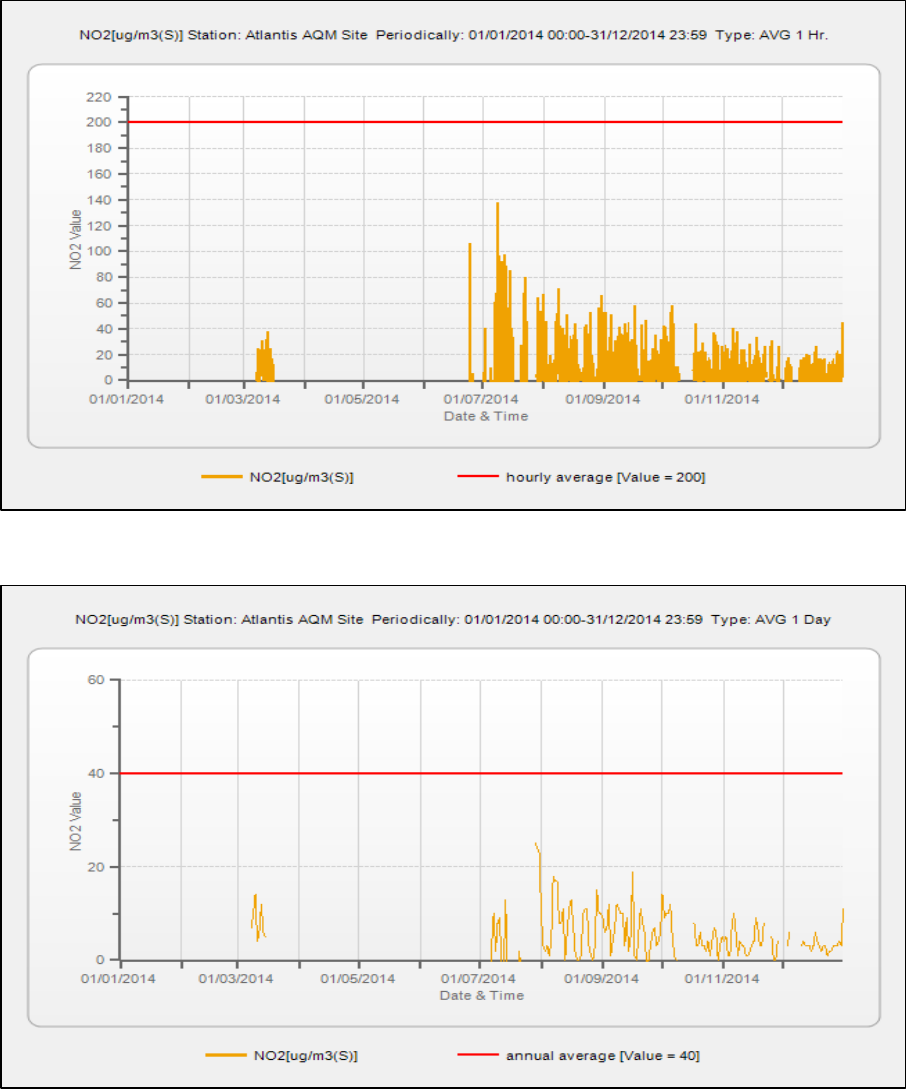
STATE OF AIR QUALITY MANAGEMENT: WESTERN CAPE 2014
98
Figure 1-125: Atlantis 1 - hourly average for NO
2
(1January 2014 – 31 December 2014)
Figure 1-126: Atlantis annual average for NO
2
(1January 2014 – 31 December 2014)
NO
2
for Atlantis did not exceed any of the NO
2
standards for the period 1 January 2014 – 31 December
2014. The highest hourly average recorded for NO
2
was 130µg/m³ on 08 July 2014. The annual average
for NO
2
was 4µg/m³ for the period 1 January 2014 – 31 December 2014. The data capture for NO
2
was
45%. The low data recovery is due to air conditioner problems experienced during the period January –
July 2014. The annual average must be viewed with caution due to the low data recovery.
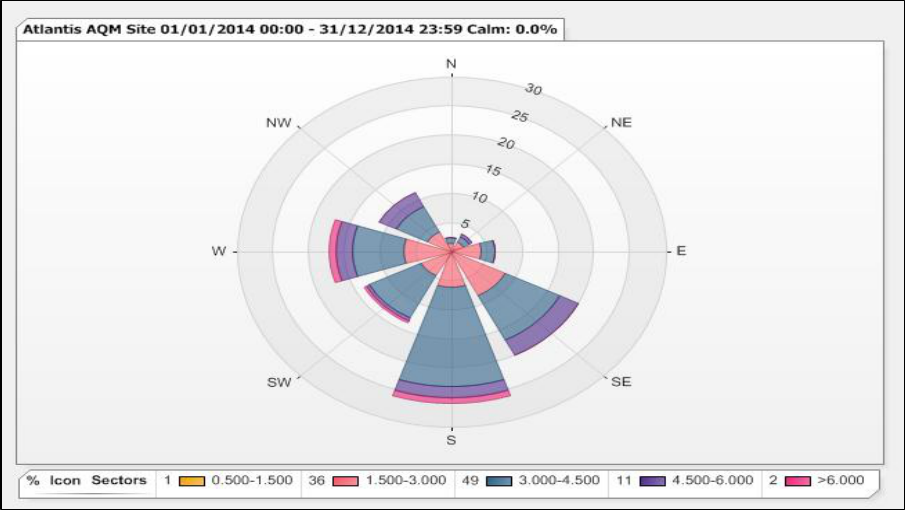
STATE OF AIR QUALITY MANAGEMENT: WESTERN CAPE 2014
99
Figure 1-127: Atlantis annual wind rose (1January 2014 – 31 December 2014)
The meteorological conditions for the period were characterized by prevalent south and south easterly
winds in the Atlantis area.
1.2.11. Summary – City of Cape Town
Generally, monitoring trends indicate an improvement in the CoCT’s ambient air quality. However, air
quality remains a matter of concern, especially in informal areas. High PM
10
levels in Khayelitsha
continue to pose a challenge in terms of air quality management. Addressing these challenges in the
midst of extreme poverty will require revolutionary solutions. In order to address this challenge, the CoCT
has recommended the establishment of an Informal Settlement Air Quality Improvement Strategy Work
Group (Gildenhuys, 2012).
Stable atmospheric conditions experienced during the winter months also trap the pollution emitted
from various sources including traffic, industries and domestic fuel usage. The high PM
10
and VOC
concentrations measured indicate that motor vehicles are the most likely sources of PM
10
during the low
wind and stable conditions.
During the summer months, moderate to high wind speeds contribute to elevated PM
10
levels from
windblown dust. PM
10
levels across the city and vehicle emissions in the city centre are of particular
concern. PM
10
levels vary from one year to the next; however, in areas such as Khayelitsha, consistently
high levels of PM
10
were monitored. In order to fully comprehend the elevated levels of PM
10
, the CoCT
has embarked on a number of initiatives to understand and determine the sources of the PM
10
emissions in the area.
STATE OF AIR QUALITY MANAGEMENT: WESTERN CAPE 2014
100
2. AIR QUALITY OFFICERS FORUM AND AIR QUALITY
MANAGEMENT PLANNING
2.1. PROVINCIAL AIR QUALITY OFFICER’S FORUM
The Western Cape Provincial Air Quality Officers Forum (AQOF) takes place quarterly and is a forum
where air quality officers of the Western Cape discuss air quality matters and coordinate progress on
the implementation of the National Environmental Management: Air Quality Act (Act No. 39 of 2004;
NEM: AQA), as well as the National Framework for Air Quality Management in the Republic of South
Africa. In addition, the forum provides air quality officials the opportunity to build, strengthen and/or
fine-tune their air quality management interventions towards the implementation of NEM: AQA and to
share experiences, challenges and to plan for the year ahead.
The Provincial Noise Control Forum forms part of the Western Cape AQOF to ensure and improve the
co-ordination of noise control in the Province. Participants are informed of achievements and
challenges with regards to noise management in the Western Cape. The Western Cape Provincial
Noise Control Forum’s success depends on extensive support from the noise control community,
inclusive of municipal support.
The Western Cape AQOF takes place across the five District and the Metropolitan Municipality within
the Province. If needed, special AQOFs are arranged to afford officials the opportunity to address air
quality-related matters with the National Department of Environmentmal Affairs (DEA).
The scope of the AQOF is to provide clarity on complex air pollution/noise matters and also to report air
quality challenges and successes, as well as areas that need further improvement. Focus areas for
deliberations in 2014 included the proposed NEM: AQA amendments, Atmospheric Emission Licensing
(new applications, processing fee, applications for postponement of compliance time-frames, etc.),
compliance monitoring and enforcement, as well as streamlining government ambient air quality
monitoring initiatives.
During 2014, the Western Cape AQOF meetings were held during the following periods:
13- 14 February 2014 in Citrusdal, West Coast District Municipality;
15 - 16 May 2014 in Cape Town, City of Cape Town;
14 - 15 August 2014 in Calitzdorp, Eden District Municipality; and
01 – 02 November 2014 in Cape Town, City of Cape Town – Special AQOF
A brief summary of the activities discussed at the AQOF is presented in Sections 2.1.1. – 2.1.3. below.
2.1.1. Key Discussion Topics at AQOF
The following presentations were delivered by the air quality officers (AQOs) and/or external presenters
at the AQOF:
Forum 1: (13-14 February 2014)
National Dust Control Regulations – Lotta Mayana
Amended Section 21 Listed Activities Implementation – Dr Greg Scott
Introduction to Hydraulic Fracking – Dr Geg Scott
Health Risk Assessment and Human Health Studies – Christian Pauw
Health Risk Assessment Epidemiological studies – Bettina Genthe
Forum 2: (15-16 May 2014)
Overview of the Provincial AQ Projects 2014/2015 – H. Wingrove
Handling of applications that does not trigger an EIA or AEL
AEL Postponement Process
Registration of Controlled Emitters
Ambient Air Quality Monitoring Stations
Forum 3: (14-15 August 2014)

STATE OF AIR QUALITY MANAGEMENT: WESTERN CAPE 2014
101
Variation of an Atmospheric Emission Licence, and Animal Matter Processing – Section 21 Listed
Activities – Cape EAPRAC
NEM: AQA Amendments and AEL implications – L. Moja (DEA)
Climate Change Response Strategy – L. Jennings
Forum 4: Special Air Quality officer’s forum (01-02 November 2014)
NEM: AQA Amendments, Provisions and Associated Implications – Vumile Sunene
NEM: AQA Draft AEL Processing Fee Regulations – Vumile Sunene
NEM: AQA Amendments to Section 22A – Vumile Sunene
NEM: AQA Draft AEL Appeal Regulations – Vumile Sunene
Bio Gas / Animal Matter Licensing Challenges - Piet Fabricius
Section 22A Calculator for determining Administrative Fines
Dust Regulations
NAEIS Capacity Building Training:
AEL Postponement applications
Submissions: Section 22A SOP
Air Quality Governance Lekgotla (2014)
The Air Quality Governance Lekgotla is an annual event that provides air quality officials from all
spheres of government the opportunity to share experiences, challenges and to plan for the year
ahead. It is aimed at providing a forum for coordination and capacity building in air quality
management and therefore strengthens cooperation and collaboration between the three spheres of
government (national, provincial and local) towards improved accountability.
It has been ten years since the promulgation of the National Environmental Management: Air Quality
Act (39) of 2004; NEM: AQA. Government has been implementing several programmes at the national
and local level in an effort to improve the quality of air and protect the right of all in South African to air
that is not harmful to their health and wellbeing.
The 2014 Lekgotla focused on the implementation of NEM: AQA, its highlights, successes and the areas
that need improvement. The topics discussed included the Atmospheric Emission Licenses related issues
such as the APPA – NEM: AQA transition, applications for postponement of compliance requirements,
new AEL applications, the AEL Processing Fee and streamlining government ambient air quality
monitoring initiatives.
2.1.2. Health Risk Assessment Study
A needs analysis to conduct Human Health Risk Assessment (HRA) was undertaken. The needs analyses
aimed at identifying and prioritising areas in the Western Cape Province where air quality is of growing
concern in terms of its effects on human health on susceptible population groups; and to include a
detailed protocol that would inform the commissioning of HRA studies in the prioritized areas. Public
consultations were held in Khayelitsha, Milnerton, and Oudtshoorn. The HRA on air quality in the
Province was conducted and took the areas listed in Table 2-1 into account.
Table 2-1: List of areas where Epidemiological Studies and HRA Studies are to be undertaken
Type of study
Municipality
Epidemiological Study
HRA

STATE OF AIR QUALITY MANAGEMENT: WESTERN CAPE 2014
102
Cape Town
1.Milnerton/Milnerton Ridge including
Phoenix and Joe Slovo
2.Nyanga, Philippi, including Khayelitsha
1.Bluedowns and Elsies River
2. Fisantekraal
3.Table View, Bothasig and
Richwood
Eden
3. Oudtshoorn
4. Mossel Bay
West Coast
N/A
5. St Helena Bay
6. Saldanha Bay
Overberg
N/A
7. Grabouw
Cape Winelands
N/A
8. Paarl and Wellington
2.1.3. Municipal Air Quality Officer’s Forum
Within the Province, four District Municipalities, viz; WCDM, EDM, CWDM and ODM have established
Municipal Air Quality Forums, within their respective areas. The municipal forums are conducted on a
quarterly basis and attended by industries that operate under NEM: AQA Section 21 Listed Activities,
the Local Municipal AQOs, as well as Provincial AQOs. The forums serve as a platform to communicate
air quality matters with stakeholders. The WCDM forum has civil society bodies incorporated into its
forums.
Activities at the municipal forums include, amongst others:
Presentation of quarterly reports by industries to the competent authorities in order to establish
compliance, as well as non-compliance to air quality minimum emission standards and other
conditions of the AELs.
The District Municipalities share information with industries on air quality notices/amendments
and promulgation of regulations, legislations and standards.
Local Municipal AQOs attend the forums to gain information on the performance of the
industries in their areas.
2.2. AIR QUALITY MANAGEMENT PLANNING
According to NEM: AQA, Section 15 (1) and (2), it is a legal requirement that D: EA&DP and
Municipalities develop Air Quality Management Plans (AQMPs). The D: EA&DP’s AQMP for the Western
Cape Province was approved in 2010.
A Steering Committee and three (3) Technical Working Groups were established to implement and
achieve the goals identified in the AQMP. The working groups were chaired by Municipal and
Provincial staff.
2.2.1. Provincial Air Quality Management Plan
The Technical Working Group meetings were held in 2014, as follows:
13- 14 February 2014 in Citrusdal, West Coast District Municipality;
15 - 16 May 2014 in Cape Town, City of Cape Town;
14 - 15 August 2014 in Calitzdorp, Eden District Municipality; and
01 – 02 November 2014 in Cape Town, City of Cape Town – Special AQOF.
STATE OF AIR QUALITY MANAGEMENT: WESTERN CAPE 2014
103
A summary of the progress made by all three Technical Working Groups in terms of implementing the
Provincial AQMP is presented below.
2.2.2. Implementing the Provincial AQMP
2.2.2.1. Working Group 1 Air Quality Management and Climate Change
Chairman: Mr Jimmy Knaggs – Drakenstein Local Municipality and Sally Benson - D: EA&DP
Progress with regard to the development of municipal AQMPs was assessed. During 2014, the CKDM
had their AQMP approved and adopted by Council. All the District Municipalities and the Metro have
approved and adopted AQMPs. Seven (7) Local Municipalities have draft AQMPs and five (5) Local
Municipalities have not developed AQMPs.
Progress with regards to the development of the emissions inventory, Municipal By-laws, AQMPs and the
status of incorporation of AQMPs, as sector plans into IDPs, were also assessed. During 2014, the
Swartland and Cape Agulhas Local Municipalities adopted By-laws. The Working Group emphasised
that municipalities promulgate By-laws that are not in contradiction with District Municipal functions.
The D: EA&DP developed the WC Climate Change Response Strategy and focused on the following
topics:
The updated Energy Consumption and CO
2
emissions database.
The revised climate change response strategy.
An introduction to the implementation and monitoring and evaluation frameworks to assess
implementation of the climate change strategy. Nine (9) focus areas were included in the CC
Response Strategy, namely: Energy Efficiency/Demand Side Management, Renewable Energy,
Sustainable Transport, Built Environment(Critical Infrastructure, Waste Management, Human
Settlements), Coastal Management, Healthy Communities, Food Security, Biodiversity and
Ecological Goods and Services, Water Security and Management.
The IDP Assessment Framework to assess the incorporation of climate change into municipal
master planning.
2.2.2.2. Working Group 2 Air Quality Education and Awareness Raising
Chairman: Mr Piet Fabricius – West Coast District Municipality and Fundiswa Zingithwa-Lwana - D: EA&DP
All Municipalities provided feedback with regards to awareness raising programs undertaken within
their areas.
The CoCT has successfully implemented a Shack Fires Programme and Primary schools were visited. The
programme was well received by the educators and principals, as it was in line with the grade 5, 6 and
7 curricula. As a result, the CoCT was requested to continue. The CoCT has a dedicated official to raise
awareness in schools.
The EDM reported that its Clean Fires Campaign was on-going and that promotional materials were
regularly distributed at shopping malls and clinics.
The ODM established an Air Quality Forum with the Local Municipalities.
The WCDM reported that industry was well represented in its Air Quality Forums.
2.2.2.3. Working Group 3 (Compliance Monitoring and Enforcement)
Chairman: Mr Johann Schoeman - Eden District Municipality and Peter Harmse - D: EA&DP
In terms of air quality management By-laws, a section of the CoCTs By-Law was amended and used for
the ODM and Cape Agulhas Local Municipality.
The WCDM, CWDM, EDM and the ODM have established Air Quality Management Working Groups,
attended by industries which report quarterly on compliance with Atmospheric Emissions License
STATE OF AIR QUALITY MANAGEMENT: WESTERN CAPE 2014
104
conditions. Drakenstein Municipality has an Environmental Management Committee where air quality
management matters are discussed.
2.2.3. Summary and Conclusions
The AQOF continues to serve as a platform to communicate and share information on air quality
related matters. The AQOF is conducted over two days, the first day focuses on generic air quality
matters and the second day of the meeting devoted to giving effect to the Provincial Air Quality
Management Plan through Working Groups.
STATE OF AIR QUALITY MANAGEMENT: WESTERN CAPE 2014
105
3. AIR QUALITY COMPLIANCE AND ENFORCEMENT
3.1. ATMOSPHERIC EMISSION LICENSING
The National Environmental Management: Air Quality Act (Act No. 39 of 2004) (NEM: AQA) was
promulgated to reform and update air quality legislation in South Africa. The NEM: AQAs objectives are
linked to the overarching sustainable development principles as set out in the National Environmental
Management Act (Act No. 107 of 1998) (NEMA). In addition, it also sets out the legal requirements for
licensing authorities in terms of access to information, viz. the Promotion of Access to Information Act
(Act No. 2 of 2000), as well as the administrative justice legal requirements, viz. the Promotion of
Administrative Justice Act (Act No. 3 of 2000).
In terms of atmospheric licensing, the holder of the Atmospheric Emission Licence (AEL) or Provisional
Atmospheric Emission Licence (PAEL) must ensure that all unit processes and appliances, as well as
mitigation measures used for the purpose of undertaking the listed activity in question are at all times
appropriately maintained and operated. D: EA&DP continued with the AEL training capacity building
workshops to air quality management officials of Overberg District Municipality (ODM) in order for them
to be self-sufficient in executing the licensing function. The training workshops included Technical
guideline documents and AEL templates as part of the capacity building exercises.

STATE OF AIR QUALITY MANAGEMENT: WESTERN CAPE 2014
106
3.1.1. Atmospheric Emission License Renewals
The D: EA&DP issued AELs to municipalities in terms of section 21 Listed Activities (Government Notice
No. 248, promulgated in Government Gazette No. 33064 of 31 March 2013 and Government Notice No.
893 promulgated in Government Gazette No. 37054 of 22 November 2013) of the National
Environmental Management: Air Quality Act, (Act No. 39 of 2004, as amended); (NEM: AQA).
Regulation 9 (1) of the NEMA EIA Regulations, 2010 and section 40 (3) and 40 (4) (a) (b) (c) of the NEM:
AQA state that the competent authority must meet timeframes applicable to the processing of
applications. The D: EA&DP continues to process AEL applications within legislated timeframes.
Focus areas for the D: EA&DP during 2014 included assessing the National Environmental Management:
Air Quality Amendment Act (Act No. 20 of 2014), Atmospheric Emission Licensing (new applications,
processing fee, applications for postponement of compliance time-frames, etc.); compliance
monitoring and enforcement, as well as streamlining government ambient air quality monitoring
initiatives.
Registration Certificates issued in terms of the Atmospheric Pollution Prevention Act (Act No. 45 of 1965;
APPA) expired on 31 March 2014. The D: EA&DP informed all licensing authorities to initiate the
processing of valid APPA Registration Certificates and to convert the certificates to AELs. In addition, all
facilities in possession of valid APPA certificates were aware that an application for renewal must, in
terms of section 61(2) (c) NEM: AQA, be lodged with the relevant Licensing Authority prior to 31 March
2014, else the validity of those APPA certificates will expire.
The D: EA&DP provided support to various other AEL licensing authorities in the Western Cape,
especially with APPA certificate renewal applications. In terms of the AEL renewals, the license holder is
required to conform to the requirements as set out in Sections 38, 40 and 43 of NEM: AQA.
The following is a summary of the D: EA&DPs activities in terms of support provided to Municipalities in
terms of section 21 Licensing Activities:
AEL Renewal applications (issuing of licences before 31 March 2014 deadline)
D: EA&DP was requested by Licensing Authorities (Cape Winelands District Municipality and
Overberg District Municipality) to assist with completing and issuing of Provisional Atmospheric
Emission Licence Applications prior to 31 March 2014 (deadline). A capacity building session,
specifically focusing on brick making applications was held at the D: EA&DP offices. Key points
of the licensing process were discussed and the licensing authorities were given the opportunity
to put forward specific matter they faced in issuing the licences in their jurisdictional areas.
Together, the group completed a licence. The session ended with a discussion on the way
forward and members agreed on a strategy that would aid them in meeting their deadline.
AEL workshops (Overberg District Municipality)
The D: EA&DP hosted three capacity building workshops to provide support to the Overberg
District Municipality. The workshops allowed the District’s Air Quality Officials to systematically
work through their Provisional Atmospheric Emission Licence Applications. Specialist advice was
given where required.
AEL assistance requested (Cape Winelands District Municipality)
D: EA&DP-AQM assisted Cape Winelands District Municipality Air Quality Officials with a
Strategic Infrastructure Project (SIP) AEL application in 2014. AQM officials attended a meeting
to discuss key matters pertaining to the licence, including the determination of the processing
fee, as well as conducting a site inspection of the facility.
Table 3-1 provides a summary of the PAEL and AEL applications issued in the Western Cape, as at 31
December 2014.
Table 3-1: AEL applications processed in the Western Cape, as at 31 December 2014
Licensing Authority
Number of PAEL issued
Number of final AEL
issued
City of Cape Town
14
19

STATE OF AIR QUALITY MANAGEMENT: WESTERN CAPE 2014
107
West Coast DM
5
9
Eden DM
8
25
Cape Winelands DM
2
12
Overberg DM
4
0
Central Karoo DM
0
0
D: EA&DP - Western Cape
1
0
TOTAL
34
65
3.2. MONITORING COMPLIANCE AND ENFORCEMENT
The focus and primary mandate of the D: EA&DP, in terms of the environment, is section 24 of the
Constitution of the Republic of South Africa (Act No. 106 of 1996), which is stated as the right to an
environment that is not harmful to health or well-being. In support of this provision to defend people’s
health and compliance with environmental laws, the D: EA&DP coordinates compliance inspections to
monitor compliance with conditions of AELs issued to facilities in terms of section 21 Listed Activities of
NEM: AQA.
3.2.1. AQA Amendments and Enforcement
The National Environmental Management: Air Quality Amendment Act (Act No. 20 of 2014);
(NEM: AQAA) was promulgated in Government Gazette No. 37666 of 19 May 2014 to amend and
substitute certain sections and to delete certain obsolete provisions of the NEM: AQA.
Although the NEM: AQAA introduced a number of amendments, two significant amendments are listed
below:
a) Amendments to Section 22A empowered Licensing Authorities to address the unlawful
conduct of listed activities in the following two (2) scenarios, namely where activities were
operated:-
o without a Provisional Registration or Registration Certificate, of a scheduled process in
terms of the Atmospheric Pollution Prevention Act, (Act No. 45 of 1965); (APPA), at any
time prior to the commencement of the NEM: AQA; and
o without a Provisional Atmospheric Emission Licence (PAEL) or an Atmospheric Emission
Licence (AEL), and therefore conducted an activity listed in terms of Section 21 of the
NEM: AQA, which results in atmospheric emissions.
b) The amendment to Section 36 empowers the Provincial Member of the Executive Council
(MEC) or the Minister to take a decision in the place of the licensing authority under certain
circumstances.
3.2.2. Regulatory Measures
During 2014, D: EA&DP consulted all Licensing Authorities (Municipal and District Municipalities) in the
Western Cape and provided collective comment on various regulatory measures pertaining to
NEM: AQA, which includes the following:
Air Dispersion Modelling in the Republic of South Africa as contemplated in section 53(p)
of the National Environmental Management: Air Quality Act 39 of 2004; this regulation
was promulgated on 11 July 2014.
Regulations regarding Pollution Prevention Plans in the Republic of South Africa as
contemplated under section 29(3), 53(o) and (p) of the National Environmental
Management: Air Quality Act 39 of 2004.
Draft Regulations regarding Appeals in the Republic of South Africa as contemplated
under section 41(a) read with section 43(4) of the National Environmental Management
Act, Act no 107 of 1998.

STATE OF AIR QUALITY MANAGEMENT: WESTERN CAPE 2014
108
National Environmental Management: Air Quality Amendment Act No. 20 of 2014,
promulgated on 19 May 2014, with particular focus on the insertion of section 22A,
Consequences Of Unlawful Conduct of Listed Activity Resulting in Atmospheric Emissions.
3.2.3. AEL Compliance Inspections
During 2014, officials from the Directorate: Air Quality Management (D: AQM) provided support and
assisted with the Basic Environmental Management Inspector (EMI) Training Course for municipal
officials in Cape Town. The course facilitated by the Western Cape’s Directorate Environmental
Governance and Enforcement, was the first EMI course presented by a Provincial Government in South
Africa. EMIs are empowered to enforce any authorisations issued under their mandated legislation,
including permits and licences such as atmospheric emission licences under NEM: AQA.
As part of the Regulatory APP deliverables, the D: AQM led six (6) AEL compliance inspections during
2014, with the assistance of Air Quality Officials from the District Municipalities and in some cases Local
Municipality officials. This promoted cooperative governance and built capacity in the municipalities
where air quality is a relatively new field of specialisation.
The compliance inspection process started by way of notification to the facility in order for them to
prepare requested documentation. Various Section 21 Listed Activities were targeted for auditing
purposes i.e. animal matter processing, combustion installations, mineral processing, storage and
handling. Each compliance inspection consisted of at least two (2) contact sessions where authorities
discussed AEL conditions, compliance with those conditions and measures to improve the air quality
management of the facility. The audit entailed assessing the AEL conditions with the facility
representatives, a presentation from the facility detailing their processes and a site inspection to
determine the physical state of the facility. The product of a compliance inspection is a comprehensive
report on the management of air quality by the facility and informing the facility of the outcome of the
audit, within a specified period of time.
During 2014, six (6) facilities were inspected in the following regions:
City of Cape of Town Metropolitan Municipality – one (1) Oil Recycling Facility;
Eden District Municipality – three (3) Animal Matter Processing Facilities;
Overberg District Municipality – one (1) Lime Processing Facility;
West Coast District Municipality – one (1) Iron and Steel Facility.
The D: AQM and WCDM air quality officials assisted the Department Environmental Affairs (DEA) with a
full compliance inspection on four (4) fishmeal processing plants within the West Coast District
Municipality (WCDM).
3.2.4. Inter-Governmental Task Teams
The Inter-Governmental Task Teams (IGTTs) (Table 3-2) continued with its activities in 2014 in cases
where complaints were complex. Table 3-2 provides a summary of the cases handled by the IGTT
during 2014.
Table 3-2: Inter-Governmental Task Teams
No.
Area
Nature of Complaint
1
EDM:
Oudtshoorn
The IGTT in Oudtshoorn is chaired by EDM and focused on various issues such as the
investigation of alleged odours emanating from industrial processes in Oudtshoorn. The IGTT
has been working closely with the industries concerned. Since the IGTT was established the
complaints have decreased to a point where the IGTT involvement and interventions were no
longer required. Routine visits by the EDM are undertaken to ensure that industries in the area
comply with their AEL conditions.

STATE OF AIR QUALITY MANAGEMENT: WESTERN CAPE 2014
109
2
WCDM:
Saldanha Bay
The IGTT was established to investigate complaints received regarding iron ore dust pollution in
Saldanha Bay. Some complaints were also escalated to Mayoral, Public Protector and
Ministerial levels. The IGTT, headed by WCDM, and comprising of officials from the National
DEA and D: EA&DP, continued with the assessment of action plans implemented in order to
ensure that dust emissions in the area do not pose a nuisance or health risk to surrounding
communities. This matter is ongoing and various interventions by the facility are being sought to
reduce iron ore dust emissions in the area.
3
WCDM:
St. Helena Bay
The IGTT continued with its investigations to address the alleged odours emanating from the
industrial process in the St. Helena Bay area. Substantial progress on conditions set in the
authorisation has been made after the review of the PAEL of the fishmeal industries in the area.
Various odour abatement equipment and measures are in place, as required per the
authorisations. The odour related complaints have declined since 2013. Officials from all three
spheres of Government are active partners in the IGTT and were involved in the APPA/PAEL
review process.
3.2.5. Air Pollution Complaints
The number of environmental related incidents and complaints received are an important element in
the D: EA&DPs efforts to protect the environment. During 2014, D: EA&DP assisted with the investigation
of air pollution related complaints in the Western Cape. Special meetings were arranged to discuss
complaints as result of agricultural burning on farms in the Porterville/Riebeeck-Kasteel area.
The incidents or complaints reported in 2014 were either investigated or referred to Local / District
Municipalities and the City of Cape Town Metropolitan Municipality (CoCT). During this period, D:
EA&DP attended to various complaints lodged at the Department. The complaints included alleged
noise, odour, dust and black smoke emissions from industries in the CoCT (Hout Bay, Milnerton, Eerste
River, Klipheuwel, Kraaifontein, Brackenfell and Central Business District), Cape Winelands District
Municipality (Tulbagh and De Doorns), West Coast District Municipality (Saldanha Bay and
Malmesbury), Overberg District Municipality (Gansbaai and Botriver) and Eden District Municipality
(Oudtshoorn). All the reported incidents were processed and finalised.
The CoCT received the most complaints in 2014, mainly as a result of noise activities, while the CWDM,
WCDM and EDM’s complaints were mainly ascribed to odours Figure 3-1.
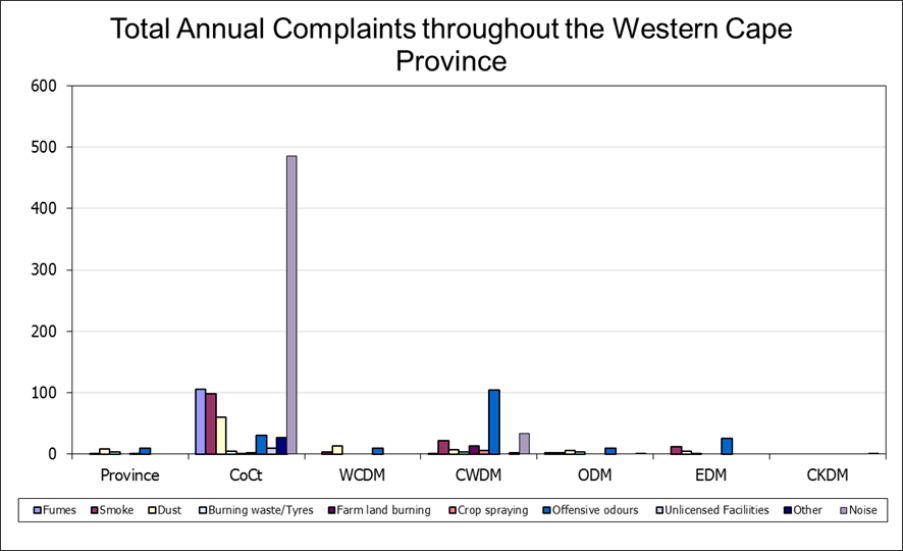
STATE OF AIR QUALITY MANAGEMENT: WESTERN CAPE 2014
110
Figure 3-1: Total Complaints received during 2014 in the Western Cape
3.3. EMISSIONS INVENTORIES
In terms of Sections 12 (b-c) and 43(l) of the NEM: AQA, the Minister must prescribe the manner in
which:
“a). measurements of emissions from point, non-point or mobile sources must be carried out; and
b). the format in which such measurements must be reported on and the organs of state to whom
such measurements must be reported to.”
The D: EA&DP developed the Western Cape Air Pollutant and Greenhouse Gas Inventory during 2011.
The inventory houses data on point, non-point and mobile sources of air pollution in the Province. This
information was subsequently made available to the National DEA for developing and populating the
South African National Atmospheric Emissions Inventory System (NAEIS).
Furthermore, the DEA, notified authorities of their intention to develop an additional system for
Atmospheric Emission Licensing to enhance the function of the NAEIS and to aid in the processing of
AEL’s. The NAEIS is an online national atmospheric emissions monitoring and reporting system, with the
purpose to provide accurate, current and complete information on all significant sources of identified
atmospheric emissions, including greenhouse gas emissions. The relevance for other Directorates within
the D: EA&DP is that the information on NAEIS can also feed into Waste Management and Climate
Change Directorate activities.
The D: EA&DP assisted in the reporting of sources to the NAEIS during the initial phase of
implementation; only facilities in possession of a Provisional or final Atmospheric Emission Licence were
considered in the process.
During 2014, the D: EA&DP’s AQM officials provided basic training to facilities and authorities on the
NAEIS online system; user guidelines were provided by the DEA on the NAEIS system during the testing
phase.
It is envisaged that improved management of the Western Cape’s Air Pollutant and Greenhouse Gas
Emissions Inventory will be attained through the use of NAEIS, particularly as it provides the ability for
authorities to manage the reporting online; reports can be used to inform economic development
STATE OF AIR QUALITY MANAGEMENT: WESTERN CAPE 2014
111
within the Province. With the imminent promulgation of the National Atmospheric Emissions Reporting
Regulations, the D: EA&DP has planned capacity building workshops for authorities and facilities in the
following financial year. The Western Cape Air Pollution and Greenhouse Gas Emissions Inventory and
NAEIS platform can also be used as a decision supporting tool to inform air quality management
planning in the Western Cape.
3.4. SUMMARY
The roles and responsibilities with respect to atmospheric emission licensing have been fully accepted
by the Western Cape Licensing Authorities. The renewal of AELs has been extensively planned and
discussed at the various AQOFs in order to gain a common understanding of the processes required. As
at 31 December 2014, a total of 65 AELs and 34 PAELs were issued in the Western Cape.
Inter-governmental co-operation continued in terms of compliance and enforcement actions on air
quality management in the Province. Well organized compliance and enforcement inspections were
carried out at various sites in Mossel Bay, City of Cape Town and Saldanha Bay to identify illegal AEL
activities and to address complex air quality complaints. The use of IGTTs proved invaluable when
multi-disciplinary enforcement actions by all three spheres of government are required. The multi-
disciplinary approach provides for more efficient compliance monitoring, which benefits the
environment and industry.
Air quality complaints were effectively investigated and addressed by D: EA&DP and Municipalities
during 2014. In terms of improving co-operative governance, the D: EA&DP continued to assist with
complaints investigations throughout the Province.
Emission inventories remain an important tool in air quality management. It is envisaged that improved
management of the Western Cape Air Pollution and Greenhouse Gas Emissions Inventory will be
attained through the use of NAEIS. The NAEIS provides the ability to authorities to manage the reporting
online, which can be used to inform economic development within the Province. The Western Cape
Emissions Inventory and NAEIS can also be used as a decision support tool for air quality management
planning and airshed planning in the Western Cape.
4. MUNICIPAL STATE OF AIR REPORTS - 2014
The Constitution of the Republic of South Africa (Act 108 of 1996) provides the legal basis for allocating
powers to different spheres of government and thus, institutional regulation of pollution. Part B of
Schedule 4 of the Constitution lists air pollution as a local government matter to the extent set out in
section 155 (6) (a) and (7).
STATE OF AIR QUALITY MANAGEMENT: WESTERN CAPE 2014
112
In terms of the National Environmental Management: Air Quality Act (Act No. 39 of 2004; NEM: AQA),
each municipality must include in its integrated development plan contemplated in Chapter 5 of the
Municipal Systems Act, an air quality management plan, as well as describe how the relevant
municipality will give effect to its air quality management plan. Further, Metropolitan and District
Municipalities are mandated with implementing the atmospheric emission licensing system referred to
in section 21 of the NEM: AQA, and must for this purpose perform the functions of licensing authority.
The objectives of the NEM: AQA are to protect the environment by providing reasonable measures to
protect air quality and to prevent air pollution, while giving effect to Section 24 (b) of the Constitution,
in a holistic approach to air quality management.
This chapter provides an overview of the air quality management activities implemented by the City of
Cape Town Metropolitan Municipality (CoCT), West Coast District Municipality (WCDM), Eden District
Municipality (EDM), Cape Winelands District Municipality (CWDM), Overberg District Municipality (ODM)
and the Central Karoo District Municipality (CKDM).
4.1. CITY OF CAPE TOWN METROPOLITAN MUNICIPALITY (CoCT)
The main components of air quality management within the CoCT are managed by two distinct entities
within its municipal structure, viz. the Air Quality Management Unit in the City Health Directorate and
the Air Quality Monitoring Services in the Scientific Services Department of the Water Services
Directorate. The latter Directorate is primarily responsible for managing the Ambient Air Quality
Monitoring Network of the CoCT.
The Air Quality Management Unit’s main functions are to regulate S21 Listed Activities, licensed in terms
of the NEM: AQA. These activities include major industries such as petrochemical refining, storage and
handling of petroleum products; glass manufacturing; animal rendering plants including fishmeal
production; metal’s finishing sector including galvanizing and metal spray activities, clay brick
manufacturing and activities related to the thermal treatment of waste.
The unit is also responsible for enforcing the CoCTs Air Quality By-Law, with particular emphasis given to
the regulation of fuel burning appliances, open burning and emissions from compression ignition
vehicles, through daily roadside testing of diesel vehicles.
The CoCT is implementing its Air Quality Management Plan (AQMP) that was adopted by Council in the
2005/6 financial year, and has designated an Air Quality Officer, following amendments to the CoCT
System of Delegations.
4.1.1. Air Quality Management Planning
The City of Cape Town continues to work towards the stated objectives adopted in its AQMP in 2005,
namely:
Objective 1: To formulate an Air Quality Management System for the City of Cape Town.
The Air Quality Management System has been established. The Air Pollution Emission Inventory,
Geographic Information System, ADMS-Urban Dispersion Modelling and EMIT Emission inventory
software provide the systematic framework for assembling, manipulating and reviewing air quality
related data. These tools are used in conjunction with ambient air quality monitoring results to identify
areas with poor air quality and for strategy development.
The following emission sources have been reviewed with the current inventory:
Major roads
exhaust emission factors and fleet composition
non-exhaust emissions of particulates
Time varying profile
Minor roads
Domestic emissions
STATE OF AIR QUALITY MANAGEMENT: WESTERN CAPE 2014
113
Listed activities
Other fuel combustion
Waste facilities
Rail
Aircraft
Shipping
Objective 2: To specify ambient air quality standards and targets for Cape Town.
The National Ambient Air Quality Standards and any associated targets have been implemented,
enforced and reported on.
Objective 3: To monitor priority pollutants which cause brown haze and affect human health
During 2014, the Air Quality Monitoring programme experienced challenges with regards to severe staff
capacity constraints which impacted on the ambient air quality monitoring programme. ESKOM load
shedding and procurement delays also hampered service delivery. Notwithstanding these constraints,
the monitoring of priority pollutants, as well as the quality assurance and control of data is at hand.
Objective 4: To improve air quality in informal areas
The monitoring results obtained from Wallacedene and Khayelitsha monitoring stations showed that the
ambient air quality within these areas meets the National Ambient Air Quality Standards.
Objective 5: To enforce current and future legislation
The CoCT’s Air Quality Management Unit continues to enforce NEM: AQA and its Air Quality
Management By-law 2010. All staff have been trained and appointed as EMI’s, except two members
whose EMI designation is pending appointment.
Objective 6: To compile an emissions inventory for the City of Cape Town
The CoCT continues to maintain an up to date emission inventory. (See details provided below).
Objective 7: To control vehicle emission in the City
About 7779 vehicles were tested during 2014; 33 vehicles failed to meet the light obscuration limits
prescribed in the CoCT’s Air Quality Management By-law 2010. (See details below).
Objective 8: To consider air quality in land use and transport planning
The CoCT continues to roll out and extend the My City bus service to parts of the Metropolitan areas
not previously serviced.
Objective 9: Determine extent of detrimental health effects of poor air quality on population of Cape
Town.
The CoCT is participating in and supporting the Western Cape Health Risk Assessment linked to Air
Quality research that has been commissioned by the Western Cape Government D: EA&DP.
Objective 10: Establish a comprehensive educational and communication strategy for Air Quality
Management
The details of this objective are provided in Section 4.1.2. below.
Objective 11: To periodically review the air quality situation
The CoCT will embark on a formal process to review its AQMP early in 2016. Delays in the
commencement of this process have been as a result of capacity constraints and a focus on the
review of the Air Quality Management By-law 2010.
4.1.2. Education and Awareness Work Stream
The CoCT’s AQMP’s Education and Awareness Workgroup has had a less active year than previous
years. This is due primarily to the impact the Atmospheric Emission Licensing process has had on staff
capacity, which necessitated a shift in focus to this core regulatory function. However, the education
and awareness raising programmes that were given to Pre- and Primary School learners continued to
make use of “Sniffels” the air pollution sniffing cat mascot, who engages young learners across the
Metropolitan area (Figure 4.1.2.). Word of mouth generated demand continued to outstrip the CoCT’s
capacity to implement this programme.
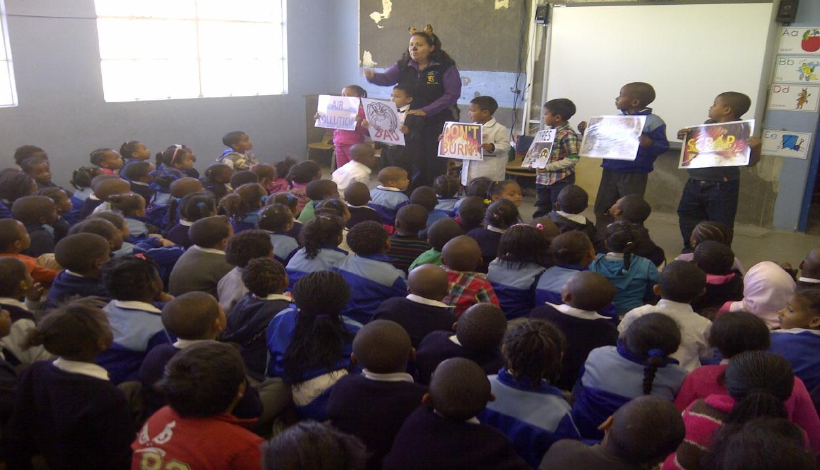
STATE OF AIR QUALITY MANAGEMENT: WESTERN CAPE 2014
114
Figure 4-1: CoCT awareness raising to Pre- and Primary school learners

STATE OF AIR QUALITY MANAGEMENT: WESTERN CAPE 2014
115
Table 4-1: Air quality management events schedule 2014
AIR QUALITY MANAGEMENT EVENTS SCHEDULE 2014
Date
Event
Co-Ordinators
Contact
Person
Where was
the event
held
Health
District
Type of
Presentation
done
Approximate
number of visitors
AQM Materials
Distributed
Event Funded By
AQM
Funded
Provided
April 2014
05 April 2014
Bulk Water Family
Fun Day
CCT: Bulk Water
William
Fortune
Bellville Sports
filed
Tygerberg
Promotional
material only
150
Colouring Books
and crayons
Bulk Water
N/A
June 2014
06 June 2014
Mitchells Plain
Educare Forum
Mitchells Plain Educare
Forum
Lory-Kay
Stern
Westridge
Civic
Mitchells
Plain Civic
Display
300
Colouring Books
and crayons
MP Educare
N/A
10 June 2014
Wittebomme
ECD Presentation
Wittebomme
ECD
Mrs Kader
Wittebomme
ECD,
Wynberg
South
Sniffles
150
Colouring Books
and crayons
Wittebomme
ECD
N/A
16 June 2014
Bokmakkerie
Youth Day
Bokmakkerie
Community Forum
Lory-Kay
Stern
Bokmakkerie
POS
Klipfontein
Public Talk
300
Colouring Books
and crayons,
AQM Booklets
Bokmakkerie
Community Forum
N/A
July 2014
02 July 2014
Suiderstrand
Holiday
Programme
CCT Social
Development
Eleanor
Oliver
Suiderstrand
Library
Eastern
Sniffles
150
Colouring Books
and crayons
Social
Development
N/A
03 July 2014
Bridgetown
Library Holiday
Programme
CCT Social
Development
Eleanor
Oliver
Bridgetown
Library
Klipfontein
Sniffles
150
Colouring Books
and crayons
Bridgetown Library
N/A
10 July 2014
Steenberg
Holiday
Programme
CCT Social
Development
Jennifer
Stacey
Steenberg
Community
Centre
South
Sniffles
150
Colouring Books
and crayons
Social
Development
N/A
10 July 2014
Lavender Hill
Holiday
Programme
CCT Social
Development
Jennifer
Stacey
Lavender Hill
Community
Centre
South
Sniffles
200
Colouring Books
and crayons
Social
Development
N/A
15 July 2014
Suiderstrand
Holiday
Programme
CCT Social
Development
Eleanor
Oliver
Suiderstrand
Library
Eastern
Presentation to
Metal Theft Unit
150
None
Social
Development
N/A
August 2014
28 August 2014
Woman’s Day
Event
CCT Social
Development
Eleanor
Oliver
Eerste River
Community
Centre
Eastern
Presentation to
Metal Theft Unit
200
AQM Booklets
Ward Clr
N/A
September 2014
30 September 2014
Biodiversity
Schools Fire
Education
Programme
CCT Biodiversity
Khulselwa
Mabuyane
Saxon Sea
Primary
School
Western
Display and
Presentation
921
Colouring Books
(200)
N/A
N/A
October 2014
23 October 2014
Bridgeville
Primary Careers
Day
Bridgeville Primary
Nadia
Schalkwyk
Bridgeville
Primary
School
Klipfontein
Display and
Presentation
100
AQM Booklets
Bridgeville Primary
School
N/A
24 October 2014
Capricorn
Primary Careers
Day
Capricorn Primary
Sue Butcher
Capricorn
Primary
School
South
Display and
Presentation
100
AQM Booklets
Capricorn Primary
School
N/A
STATE OF AIR QUALITY MANAGEMENT: WESTERN CAPE 2014
116
4.1.3. Vehicle Emissions Testing Programme
The CoCT’s Air Quality Management Unit has three dedicated diesel vehicle emissions testing teams,
comprising of a Diesel Vehicle Testing Officer and a Senior General worker per team. The teams
operate on a daily basis, carrying out roadside testing of compression ignition vehicles at
predetermined testing sites in partnership with the CoCT’s Traffic Services.
The programme was first initiated in 2000. Upon introduction of testing, the failure rate was
approximately 17% of vehicles tested. Technological advances in compression ignition engine
technology and fuel formulation along with enforcement of obscuration limits has seen the failure rate
stabilize to below 1%.
The number of vehicle tested in 2014 by the CoCT’s Diesel Vehicle Testing is reflected in Table 4-2.
Table 4-2: Total number of diesel vehicle tested during January 2014 to December 2014
Vehicle Testing January 2014 – December 2014
Passed
Failed
Total
January
849
0
849
February
804
0
804
March
576
0
576
April
696
0
696
May
642
0
642
June
260
1
261
July
538
2
540
August
496
2
498
September
705
8
713
October
631
14
645
November
722
5
727
December
827
1
828
Total
7746
33
7779
4.1.4. Monitoring, Standards and Health Work Stream
The CoCT continued to support the WCG Health Risk Assessment process through the provision of
emission inventory data and ambient air quality monitoring data. The CoCT also participated in various
Technical Committees linked to this project.
In terms of ambient air quality monitoring, a number of additional analysers were added to the CoCT
Ambient Air Quality Monitoring Network. Analysers were placed at the following locations as follows:
i. Goodwood: Ozone Analyser, CO Analyser, SO
2
Analyser
ii. Khayelitsha: PM
2.5
Analyser
iii. Tableview: PM
2.5
Analyser
Overall, however, the CoCT Ambient Air Quality Monitoring Network experienced many challenges in
terms of malfunctioning air conditioners and monitoring equipment, which resulted in a number of
stations being offline for significant periods of time during 2014. Further, the CoCT’s Air Quality
Monitoring Laboratory also experienced staff losses and expertise, which impacted on service delivery.
4.1.5. Air Quality Management Training
The following training was undertaken by the CoCT’s Air Quality Management staff during 2014:
In March 2014, three staff members attended the Department of Environmental Affairs EIA
Training Course, as offered by the University of Pretoria.
Two staff members participated in a Supervisor Skills training short course.
STATE OF AIR QUALITY MANAGEMENT: WESTERN CAPE 2014
117
Five staff attended the National Association for Clean Air (NACA) Western Cape Branch, Air
Quality Management one day Seminar
One staff member attended the Air Quality Governance Lekgotla and NACA Conference in
Durban in October 2014
4.1.6. S21 Listed Activities – Atmospheric Emission Licensing
Service rendering in relation to the implementation of the Atmospheric Emission Licensing function
continues to make up the overwhelming majority of the workload undertaken by the Air Quality
Management Unit. This includes frequent engagement with iIndustry, their appointed independent
Environmental Assessment Practitioners and Specialist Air Quality Consultants.
During 2014, a total of 14 Provisional Atmospheric Emission Licences and 19 final Atmospheric Emission
Licences were issued.
The promulgation of the NEM: Air Quality Amendment Act, (Act 20 of 2014); which came into effect on
19 May 2014 introduced a fair amount of uncertainty due its failure to include and make provision for
transitional arrangements.
STATE OF AIR QUALITY MANAGEMENT: WESTERN CAPE 2014
118
Table 4-3: S21 Listed Activities and number of Licences issued in the CoCT during 2014
CITY OF CAPE TOWN METROPOLITAN
QUARTELY TOTALS - 2014
QUARTER
PAEL/AEL APPLICATIONS
LICENCES ISSUED
NEW
RENEWAL
REVIEW
TRANSFER
VARIATION
PAEL
AEL
01 January – 31 March 2014
10
1
0
0
0
13
15
01 April – 30 June 2014
0
0
0
0
0
1
1
01 July – 30 September 2014
1
0
0
0
0
0
1
01 October – 31 December 2014
1
0
4
0
2
0
2
51
47
3
APPLICANT
DATE OF PAEL/AEL APPLICATION
APPLICATION
ADEQUATELY
COMPLETED
DATE OF LICENCES ISSUED
STATUS
NEM: AQA LISTED
ACTIVITIES/
APPA SCHEDULED
PROCESS
NEW
RENEWAL
REVIEW
TRANSFER
VARIATION
YES
NO
PAEL
AEL
REVIEW DATE
EXPIRY DATE
ACSA – AIRPORTS
COMPANY SA
_
2013/10/15
2018/02/15
_
2014/10/23
YES
_
_
2013/03/15
2018/03/15
2018/02/15
COMPLETED
FUEL STORAGE (2.4)
ACTOM-JOHN THOMPSON
AFRICA
_
2013/11/25
_
_
_
YES
_
_
_
_
_
IN PROCESS
FOUNDRY (4.10)
ADVANCED GALVANISING
CORPORATION BELLVILLE
2012/05/12
_
_
_
YES
_
_
2014/03/31
2019/01/20
2019/03/20
COMPLETED
GALVANISING (4.11)
AFRICAN OXYGEN LTD
(CAPE TOWN)
_
2012/02/16
_
_
_
YES
_
2013/08/27
2014/10/08
2014/05/27
2014/08/27
COMPLETED
ORGANIC
CHEMICALS
INDUSTRY (6)
AIR LIQUIDE (CAPE TOWN)
_
2013/03/28
_
_
_
YES
_
_
2013/03/28
2018/11/23
2019/05/23
COMPLETED
ORGANIC
CHEMICALS (6)
APOLLO BRICKS-
BRAKKEFONTEIN CLAY
PRODUCTS
_
2012/05/27
_
_
_
YES
_
2014/03/20
2014/03/20
2017/01/31
(PAEL)-
2019/01/31
(AEL)
2017/03/20
(PAEL)-
2019/03/20
(AEL)
COMPLETED
CERAMIC PROCESS
(5.9) AND CLAMPS
(5.3)
ATLANTIS FOUNDRY
_
2013/11/21
_
_
_
YES
_
_
2014/09/19
2019/06/19
2019/09/19
COMPLETED
DRYING (5.2);
FOUNDRY (4.10)
BCL MEDICAL WASTE
MANAGEMENT
2012/09/05
_
_
_
2014/12/11
NO
_
_
_
_
IN PROCESS
THERMAL TREATMENT
OF HAXZARDOUS
WASTE (8.1) AND
VETERINARY
CREMATION(8.2)
BP (MONTAGUE GARDENS)
_
2013/08/08
_
_
_
YES
_
_
_
_
_
IN PROCESS
FUEL STORAGE (2.4)
CAPE GALVANISING (PTY)
LTD
2014/03/31
_
2019/03/31
_
_
YES
_
_
2014/03/31
2014/01/01
2019/01/01
COMPLETED
GALVANIZING (4.22)
CHEVRON BALLAST AREA
(CT HARBOUR)
2014/01/14
_
_
_
_
YES
_
_
_
_
_
IN PROCESS
FUEL STORAGE (2.4)
CHEVRON MILNERTON
_
2013/03/27
_
_
_
YES
_
_
2014/03/31
_
_
COMPLETED
SUB-CATEGORY 1.2
AND 1.4; CATEGORY
2: PETROLEUM
INDUSTRY: SUB-
CATEGORIES: 2.1;
2.2; 2.3; 2.4
CISCO
2014/03/12
_
_
_
_
YES
_
_
_
_
_
IN PROCESS
ELECTRIC ARC
FURNACE AND STEEL
MAKING (PRIMARY
AND SECONDARY)
(4.7) ;

STATE OF AIR QUALITY MANAGEMENT: WESTERN CAPE 2014
119
CLAY INDUSTRIES
_
2012/11/21
_
_
YES
_
2013/06/19
_
2015/03/19
COMPLETED
CERAMIC PROCESS
(5.9)
CLAYTILE-JOOSTENBERG
BRICK
_
2010/03/15
2015/03/19
_
_
YES
_
2013/06/19
_
2015/03/19
2015/06/19
COMPLETED
CERAMIC PROCESS
(5.9)
COMAR CHEMICALS
2014/11/06
_
_
_
_
_
_
_
_
_
_
_
ORGANIC
CHEMICALS
CONSOLIDATED GLASS
WORKS
_
2013/03/22
_
_
_
YES
_
_
2014/03/21
2019/01/20
2019/03/20
COMPLETED
GLASS AND
MINERAL WOOD
PRODUCTION(5.8)
COROBRIK
(PHESANTEKRAAL)
_
2012/05/08
_
_
_
YES
_
2014/03/31
2014/12/31
2015/03/31
COMPLETED
CERAMIC PROCESS
(5.9)
COUNTY FAIR FOODS
(PTY)LTD
_
2013/02/13
_
_
_
YES
_
2014/02/21
2018/06/21
2019/02/21
COMPLETED
ANIMAL MATTER
PROCESSING (10)
DURBANVILLE
CREMATORIUM
2014/03/19
_
2015/05/14
_
_
YES
_
2014/05/14
2015/01/14
2015/05/14
COMPLETED
CREAMATORIA AND
VETERINARY WASTE
(8.2)
EKAPA DRUMS
2014/03/31
_
_
_
_
_
NO
_
_
_
_
IN PROCESS
DRUM RECYCLING
(8.4)
ENGEN-MONTAGUE
GARDENS
2011/10/07
_
_
_
_
YES
2014/01/20
2015/01/20
2014/10/20
_
COMPLETED
FUEL STORAGE (2.4)
ESKOM-ACACIA POWER
STATION
_
2014/03/20
_
_
_
YES
_
_
2014/03/20
2018/06/20
2019/03/20
COMPLETED
LIQUID FUEL
COMBUSTION (1.2);
FUEL STORAGE (2.4)
ESKOM-ANKERLIG
_
2012/09/21
_
_
_
YES
_
_
2014/03/28
2019/01/14
2019/03/28
COMPLETED
LIQUID FUEL
COMBUSTION (1.2);
FUEL STORAGE (2.4)
GEAR PUMP (ETS FOUNDRY)
2012/04/24
_
_
_
_
YES
_
2014/03/25
2014/11/20
2019/08/20
2019/11/20
COMPLETED
FOUNDRIES (4.10)
FFS REFINERS (PTY) LTD
(BRACKENFELL)
2013/03/26
_
2014/12/05
_
_
YES
_
2014/03/05
_
2014/12/05
2015/03/05
COMPLETED
FUEL STORAGE (2.4)
FFS-CT HARBOUR TANK
FARM&CT BULK STORAGE
_
2013/10/23
2014/12/05
_
_
YES
_
2014/03/14
_
2014/12/05
2015/03/14
COMPLETED
FUEL STORAGE (2.4)
FFS REFINERS (PTY)
LTD(VISSERSHOK)
_
2012/03/09
_
_
_
YES
_
_
2014/03/31
2019/01/31
2019/03/31
COMPLETED
FUEL STORAGE (2.4);
FUEL OIL RECYCLING
(2.5)
FINE CHEMICALS
CORPORATION
2013/03/27
_
_
_
_
YES
_
_
2014/03/31
2019/01/20
2019/03/20
COMPLETED
ORGANIC
CHEMICALS
INDUSTRY (6)
PRODUCTION AND
OR USE IN
MANUFACTURING
OF AMMONIA,
FLUORINE, FLUORINE
COMPOUNDS,
CHLORINE, AND
HYDROGEN
CYANIDE (7.1)
GALVATECH BK
2013/02/19
_
_
_
_
YES
_
_
2014/03/20
2019/01/30
2019/03/30
COMPLETED
GALVANIZING (4.22)
GECCO FUELS
2009/10/02
_
_
_
_
YES
_
2011/12/09
_
2012/12/10
IN PROCESS
FUEL STORAGE (2.4);
FUEL OIL RECYCLING
(2.5)
HELDERBERG GALVANIZING
2014/03/31
_
2019/01/01
YES
_
2014/03/31
2019/01/01
2019/03/31
COMPLETED
GALVANIZING (4.22)
I&J - T/A CONCENTRA LTD
2013/03/26
_
2014/11/14
_
_
YES
_
2014/02/14
_
2014/11/14
2015/02/15
COMPLETED
ANIMAL MATTER
PROCESSING (10)
JOINT BUNKERING
SERVICES(CHEVRON-CT
HARBOUR)
_
2013/03/28
2014/11/19
_
_
YES
_
2014/02/19
_
2014/11/19
2015/02/19
COMPLETED
FUEL STORAGE (2.4)
MALMESBURY STERILISASIE
AANLEG
2014/03/28
2015/01/28
_
_
YES
_
2014/02/19
_
2014/11/19
2015/03/28
COMPLETED
ANIMAL MATTER
PROCESSING (10)
METLITE ALLOYS (PTY) LTD
15/04/2011
2019/13/01
_
_
YES
_
2014/03/28
2014/05/13
2019/01/13
2019/05/13
COMPLETED
SECONDARY

STATE OF AIR QUALITY MANAGEMENT: WESTERN CAPE 2014
120
ALUMINUM
PRODUCTION (4.4)
MORE ASPHALT
_
2013/03/27
2015/01/19
_
_
YES
_
2014/03/19
_
2015/01/19
2015/03/19
COMPLETED
MACADAM
PREPARARTION
(5.10)
MUCH ASPHALT -
CONTERMANSKLOOF
_
2013/02/18
2015/01/19
_
_
YES
_
2014/03/19
_
2015/01/19
2015/03/19
COMPLETED
MACADAM
PREPARARTION
(5.10)
MUCH ASPHALT-EERSTE
RIVER
_
2013/02/15
_
_
YES
_
_
_
_
_
IN PROCESS
MACADAM
PREPARARTION
(5.10)
NGK CERAMICS
_
2011/04/11
2017/01/31
_
_
YES
_
_
2012/01/31
2016/09/30
2017/01/31
COMPLETED
CERAMIC PROCESS
(5.9)
LUCKY STAR- (FORMALLY
OCEANNA)
_
2012/06/07
2017/11/01
_
_
YES
_
_
2012/12/03
2017/08/01
2017/11/01
COMPLETED
ANIMAL MATTER
PROCESSING (10)
PENINSULA DRUMS
_
2013/03/26
_
_
YES
_
_
_
_
_
IN PROCESS
DRUM RECYCLING
(8.4)
PEX FOUNDRY-KILLARNEY
GARDENS
2013/03/28
_
_
_
_
NO
_
_
_
_
IN PROCESS
FOUNDRY
POWERTECH
TRANSFORMERS
2014/03/31
_
2015/01/01
_
_
YES
_
2014/03/31
2015/01/01
2015/03/31
COMPLETED
METAL SPRAY (4.23)
PROTEA BRASS
FOUNDRY(PTY) LTD
2014/07/15
_
_
_
_
YES
_
_
_
_
_
IN PROCESS
SECONDARY
ALUMINIUM
PRODUCTION (4.4).
PRODUCTION AND
PROCESSING OF
ZINC, NICKEL AND
CADMIUM (4.14)
PROTEA CHEMICALS
_
_
_
_
_
YES
_
_
_
_
_
IN PROCESS
INORGANIC
CHEMICAL: 7.2
PRODUCTION OF
ACIDS
RHEINMETAL DENEL
MUNITION-SOMERSET WEST
2014/03/31
2013/01/21
2019/01/01
_
_
YES
_
_
2014/03/31
2019/01/01
2019/03/31
COMPLETED
BURNING GROUNDS
(8.3)
SA METAL (AIRPORT
INDUSTRIA)
_
2013/03/28
2019/01/20
_
_
YES
_
_
2014/03/20
2019/01/20
2019/03/20
COMPLETED
ELECTRIC ARC
FURNACE AND STEEL
MAKING (PRIMARY
AND SECONDARY)
(4.7) ; COMBUSTION
INSTALLATIONS (4.2)
SA METAL (EPPING)
2014/03/31
_
2019/03/31
_
_
YES
_
_
2014/03/31
2019/01/01
2019/01/01
COMPLETED
METAL RECOVERY
(4.21)
SFF MILNERTON TANK FARM
_
_
2015/03/10
_
_
YES
_
2013/05/10
_
2015/03/10
_
COMPLETED
FUEL STORAGE (2.4)
TYDSTROOM
_
2012/02/07
_
_
YES
_
_
2012/06/05
2017/01/05
2017/02/07
COMPLETED
ANIMAL MATTER
PROCESSING (10)
STATE OF AIR QUALITY MANAGEMENT: WESTERN CAPE 2014
121
4.1.7. Air Quality-related Complaints
Noise related complaints make up the majority of the complaints received during 2014 (Table 4.4).
Good progress was achieved in resolving these matters. The CoCT also formally appointed a
“designated person” in terms of the Western Cape Noise Control Regulations, PN200 of 2013 to address
noise related complaints.
Complaints related to fumes were the second most common type of complaint received. Unauthorised
spray painting operations were also reported.
Table 4-4: Number of air quality-related complaints received in the CoCT during 2014
CoCT 2014 Complaints
Period
Category
1 January - 31
March 2014
1 April - 30
June 2014
1 July - 30
September 2014
1 October – 31
December 2014
Total
Fumes
22
14
45
25
106
Smoke
18
21
41
18
98
Dust
24
10
8
18
60
Burning waste/Tyres
2
1
1
1
5
Farm land burning
0
0
1
0
1
Crop spraying
0
1
0
1
2
Offensive odours
7
3
15
5
30
Unlicensed Facilities
0
10
0
0
10
Noise
78
127
124
156
485
Other
12
2
10
3
27
Total
163
189
245
227
824
Odour
Animal Matter Rendering Plants continue to generate the large majority of odour related complaints
received by the CoCT.
Noise
The CoCT has appointed its “designated persons” to coordinate and implement the Western Cape
Noise Control Regulations, PN 200 of 2013, thus fulfilling its legal obligations to appoint the responsible
officials within one year of promulgation of the regulations.
Successful enforcement of the regulations through the serving of compliance notices and criminal
enforcement has resulted in good levels of complaint resolution being achieved.
Inter-Governmental Task Team
The CoCT has not participated in any IGTT’s in this past calendar year.
4.1.8. Co-operative Governance
The CoCT’s Health Directorate entered into a Service Level Agreement with the its Safety and Security
Directorate - Traffic Services, for assistance with conducting roadside Compression Ignition Vehicle
testing. Traffic Officers assist with pulling over vehicles for testing purposes.
4.1.9. Recommendations and way forward
Our main recommendation relates to our Atmospheric Emission Licensing function. There is a great
need for an updated norms and standards guideline document to assist officials with interpreting the
Listing Notice 893, insofar as the description of listed activities and the application of the listing notice
are concerned. This will assist not only officials, but also independent Environmental Assessment
Practitioners and Industry alike.

STATE OF AIR QUALITY MANAGEMENT: WESTERN CAPE 2014
122
4.2. DISTRICT MUNICIPALITIES
4.2.1. WEST COAST DISTRICT MUNICIPALITY (WCDM)
The West Coast District Municipality’s Air Quality Management Section (WCDM) was officially
established on 01 December 2012. The unit is responsible for air pollution control in the area of
jurisdiction of the WCDM. Its main function is to regulate S21 Listed Activities licensed in terms of the
National Environmental Management: Air Quality Act, 2004 (Act No. 39 of 2004; NEM: AQA), as well as
Controlled Emitters. The activities regulated include, amongst others, major industries such as steel
manufacturing, cement manufacturing, handling and export of iron ore in bulk, fishmeal production,
galvanizing, crude oil storage, clay brick manufacturing, lime processes and waste incineration.
The WCDM complied with all legal requirements in terms of NEM: AQA by the end of 2011, with the final
approval of its AQMP by Council. The WCDM Air Quality Management By–law was also approved by
Council and gazetted on 06 September 2013. The functions between the District and Local
Municipalities will further be agreed upon, and will be followed by Memorandum of Understanding,
which will be entered into.
4.2.1.1. Air Quality Management Planning
An Air Quality Management Plan (AQMP) was compiled and approved by Council in November 2011
and included in the IDP. An Air Quality Management By – law has been approved by Council and was
gazetted on 06 September 2013. The AQMP will be reviewed during the 2016/2017 financial year.
Table 4-5 provides a summary of the interventions identified with respect to the WCDM AQMP.
Table 4-5: Identified matters in the AQMP of the WCDM
Intervention
Time frame
Implementation
Implementation of human resources
Appoint Chief Air
Quality Officer
Short term
Manager: Air Quality officially appointed on 06 July
2012.
Appoint an Air Quality
Officer
Short term
Senior Air Quality Officer appointed on 01 December
2012.
Appoint an Air Quality
Technician
Short to medium
term
Not implemented. Personnel structure makes provision
for second Air Quality Officer to be appointed in the
future.
Implementation of Air Quality Management Tools
Emissions Inventory
Short to long term
DEA published legislation and established an internet
based National Atmospheric Emissions Inventory
System requiring industry and local government to
report to the system on an annual basis. The emissions
inventory for the District consists of listed activities
licensed in terms of NEM: AQA.
Dispersion modelling
Medium to long
term
When required external expertise will be appointed to
conduct dispersion modelling, and will require
Budgeting.
Implementation of Air Quality Monitoring

STATE OF AIR QUALITY MANAGEMENT: WESTERN CAPE 2014
123
Ambient air quality
monitoring network
Medium to long
term.
Some ambient air quality monitoring done by industry
in Saldanha and Provincial monitoring station in St
Helena Bay and Malmesbury. Saldanha Bay
Municipality established an ambient monitoring
network comprising of two monitoring stations for
criteria pollutants, as well as seven dust fallout
monitors. The District is in the process of entering into a
MoU to facilitate future ambient air quality monitoring
initiatives.
Emission Reduction / Control Strategies
Reduce / control
domestic fuel burning
Short to long term.
Local
Municipalities to
address.
Promote the use of renewable energy and create
awareness.
Control of
transportation
emissions.
Short to long term.
Local
Municipalities in
terms of By-laws.
Do vehicle count and diesel vehicle testing. No
implementation yet.
Control of emissions
from mining activities.
Short to long term.
Local
Municipalities with
assistance from
District and
Province.
Control of dust. No implementation yet.
Control of emissions
from agricultural
activities.
Local
Municipalities with
assistance from
District and
Agriculture.
Control of dust in terms of Local Municipal By-laws.
Planning meeting with relevant authorities and
agriculture. Meeting with role players took place on 26
August 2013. No further development in this regard.
Control of emissions
from industrial
activities.
Short to long term.
District and Local
Municipalities
responsibility.
Licensing of listed activities done by District. Emissions
standards enforced through issuing of licences.
Control of emissions
from waste treatment
disposal activities.
Short to long term.
Local
Municipalities and
District with
assistance from
Provincial
Government.
Incineration controlled through licensing in terms of
NEM: AQA emission standards. Landfills still to be
properly controlled by Local Municipalities with
assistance from District and Provincial Government.
Control of emissions
from biomass burning
i.e. veld fires.
Short to long term.
Local and District
Municipality’s
responsibility.
Strict control over veld fires whether naturally
occurring or due to planned burning should be
implemented.
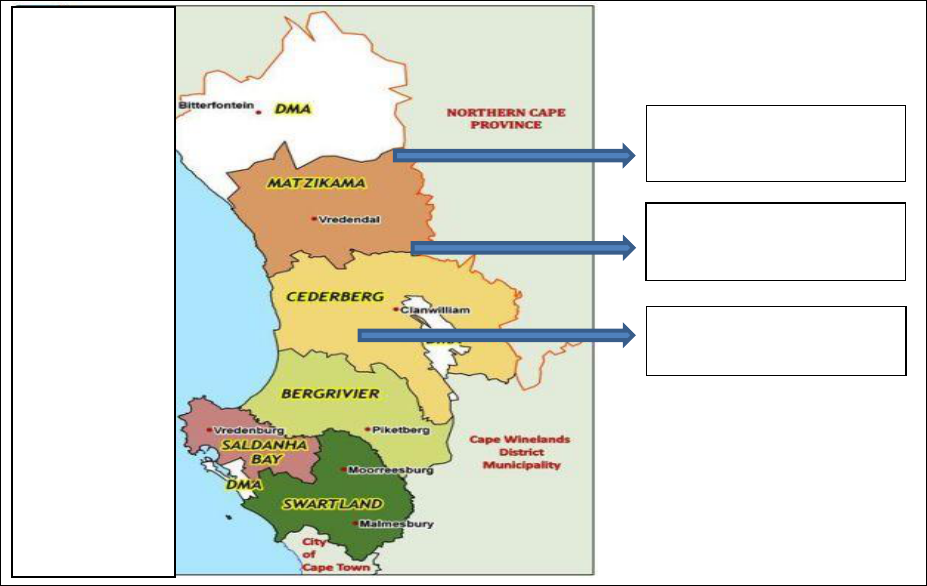
STATE OF AIR QUALITY MANAGEMENT: WESTERN CAPE 2014
124
4.2.1.2. Training
The WCDM’s Manager: Air Quality and Senior Air Quality Officer attended the following training:
Ambient monitoring: Saldanha Bay Municipality service provider during June 2014;
EIA Training: University of Pretoria: February 2014;
NAEIS training: DEA: June 2014.
4.2.1.3. Education and Awareness
Awareness raising is undertaken through the establishment of working groups and environmental
stakeholders forums. Industries impacting on the health and wellbeing of people residing in receptor
areas are required to create communication platforms and meet with residents on agreed upon
timeframes. During these meetings, the public is informed of industrial processes and the
implementation of measures to control emissions. Air Quality Officers also attend the meetings.
4.2.1.4. S21 Listed Activities – Atmospheric Emission Licensing
During 2014, the WCDM has engaged with all known S21 Listed Activities that are operational within
their jurisdictional area regarding compliance with NEM: AQA transition timeframes. Figure 4-2 shows
the location of the S21 Listed Activties in the WCDM. Seventeen of these activities are operational with
the remaining still to be authorised or constructed and commissioned.
Figure 4-2: S21 Listed Activities – AEL in the WCDM
4.2.1.5. Air Quality-related Complaints
Table 4-6 presents a summary of the complaints received during 2014. Overall, dust and odour-related
complaints formed the majority of the complaints received. The IGTT, as discussed in Chapter 3
addressed most of the dust and odour-related complaints.
Saldanha Steel
Transnet PT
SFF
Tronox
Duferco
Oceana
Oranjevis
WPP
PPC Saldanha
Premier Fishing
Chevron
Oiltanking Mogs
*Sea Harvest
*Frontier
Separation
*RMI
*Afrisam
* Chlor – Alkali
Holdings
Cape Lime, Namakwa Stene
& Tronox
PPC De Hoek, Amawandle &
*Voorberg Correctional Fac.
PPC Riebeeck, Swartland
Boudienste & *Cape Dairy
Biogas
STATE OF AIR QUALITY MANAGEMENT: WESTERN CAPE 2014
125
Table 4-6: Number of air quality-related complaints received in the WCDM
WCDM 2014 Complaints
Category
Annual Total
Fumes
0
Smoke
3
Dust
13
Burning waste/Tyres
0
Farm land burning
0
Crop spraying
0
Offensive odours
9
Unlicensed Facilities
0
Noise
0
Other
0
Total
25
Dust
A total of 13 complaints relating to dust were received during 2014. These complaints were mostly
related to iron-ore dust in the Saldanha Bay area, and were addressed through the IGTT (see Chapter
3).
Odour
A total of 9 odour related complaints were received during the reporting period; these related to
fishmeal production in the St. Helena Bay area. These complaints were addressed through the IGTT (see
Chapter 3).
Noise
No noise complaints were received during the reporting period.
4.2.1.6. Co-operative Governance
The following compliance and enforcement inspections were conducted in the WCDM. All three
spheres of government were involved in the inspections. Recommendations were made to industries to
improve their environmental management practices, where required.
Table 4-7: Compliance and enforcement inspections conducted in the WCDM (2014)
Name of industry
Industry type
Government departments
Oranjevis
Fishmeal production
DEA, DEA&DP & WCDM
Lucky Star
Fishmeal production
DEA, DEA&DP & WCDM
West Point Processes
Fishmeal production
DEA, DEA&DP & WCDM
Foodcorp
Fishmeal production
DEA, DEA&DP & WCDM
Tronox
Smelter plant
DEA&DP & WCDM
4.2.1.7. Air Quality By-laws or legislation
Air Pollution Control By-laws in the WCDM area were published as follows:
Saldanha Bay Municipality: 24 December 2012;
Bergrivier Municipality: 06 December 2013;
Swartland Municipality: 22 May 2015.
STATE OF AIR QUALITY MANAGEMENT: WESTERN CAPE 2014
126
4.2.1.8. Air Quality Forum/Industry Working Groups
The following forums / working groups were established and are currently operational in the WCDM
area:
West Coast Air Quality Working Group (WCAQWG) – 2009. This working group is chaired by the
WCDM Air Quality Officer and is attended by representatives of all listed activities within the
area of jurisdiction of the West Coast District Municipality. Limited community representation is
present and facilities regulated in terms of S21 Listed Activities are required to submit and
present a quarterly report on their environmental management interventions at the meeting.
Listed Activity Stakeholder’s Forums. In terms of the AEL conditions, it is required from industry to
establish communication forums with the public, especially in the areas where industries
contribute to nuisances relating to staining and offensive odours. Council’s Air Quality Officers
attend these meetings.
Joint Municipal Air Quality Working Group (JMAQWG). In order to improve communication and
cooperation between District and Local Municipal Air Quality Officers it is foreseen that a
communication platform will be established during 2015. This will also include the entering into
a Memorandum of understanding (MoU) between the parties involved, which also serve as a
Terms of Reference to work jointly to address air quality matters in the region.
4.2.1.9. Air Quality Monitoring
The Saldanha Bay Municipality air quality monitoring network consists of two (2) fully automated
ambient air quality monitoring stations and seven (7) dust fallout monitoring sites. These sites are
designed to measure Sulphur Dioxide (SO
2
), Nitrogen Oxide (NO), Nitrogen Dioxide (NO
2
), Oxides of
Nitrogen (NOx), Ozone (O
3
), Particulate Matter (PM
10
and PM
2.5
) and meteorological parameters. The
co-ordinates of the monitoring sites are listed in Table 4-8 and the relative locations are shown in Figure
4-3.
Table 4-8: The co-ordinates of Saldanha Bay Municipality Air Quality Monitoring Network
Continuous Monitoring Stations
Latitude (Degree S)
Longitude (Degree E)
Louwville substation
32° 54’ 30.3”
18° 00’ 32.2”
Saldanha Bay Harbour
33° 00’ 57.0”
17° 56’ 43.3”
Saldanha Bay substation
1
33° 00’ 03.7”
17° 56’ 42.2”
Dust Fallout Stations
Latitude (Degree S)
Longitude (Degree E)
Vredenburg Electricity Department
32° 54’ 27.2”
17° 59’ 13.7”
Vredenburg reservoir
32° 54’ 56.1”
17° 59’ 12.9”
Juffroushoogte
32° 56’ 13.8”
18° 04’ 33.6”
Airport
32° 57’ 34.5”
17° 58’ 12.5”
Andrews Primary School
33° 00’ 41.0”
17° 56’ 18.5”
Blue Water Bay
32° 59’ 43.8”
17° 58’ 24.7”
Curro School
33° 02’ 16.2”
18° 02’ 59.9”
1
: Relocated in November 2014
Both the monitoring stations were commissioned during July 2014, but were vandalised shortly after they
were commissioned. The station at Saldanha Bay Harbour was relocated to the Saldanha Bay sub-
station in town in November, while the Louwville station was vandalised in early November and was not
recommissioned during 2014. Data capture was 24% at Saldanha Bay and 27.43% at the Louwville
station and therefore not reported on for 2014.
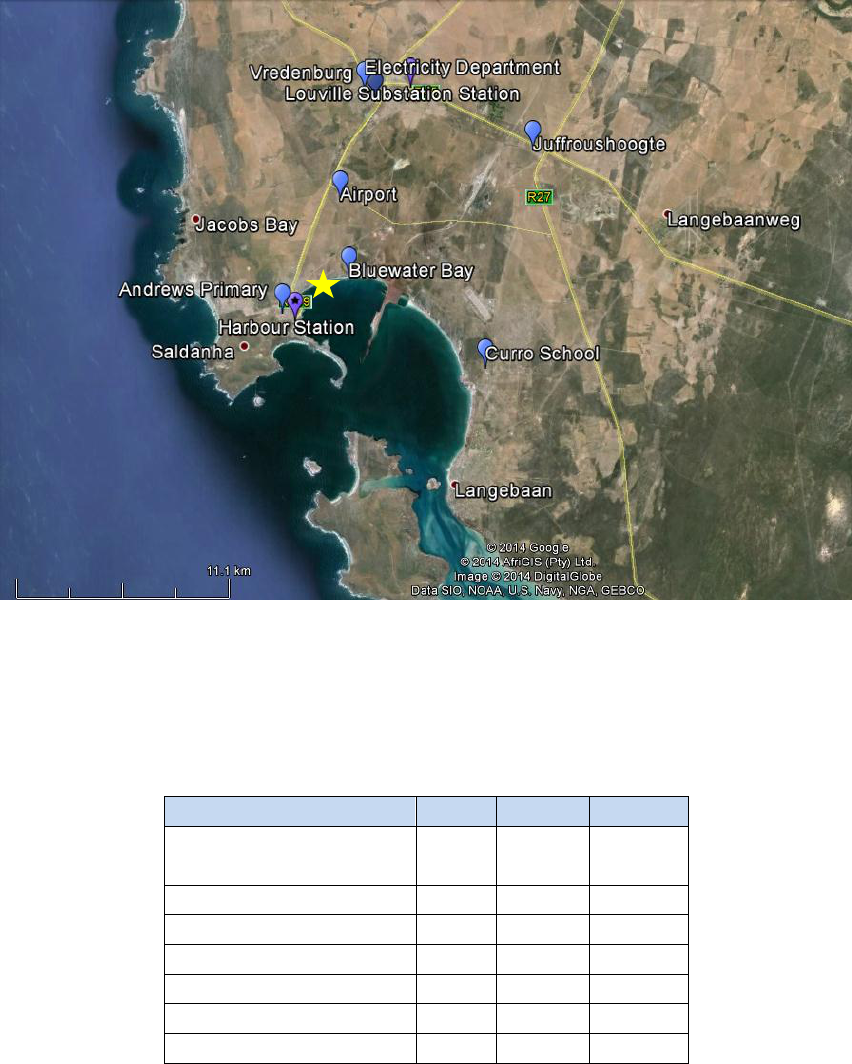
STATE OF AIR QUALITY MANAGEMENT: WESTERN CAPE 2014
127
Figure 4-3: The location of Saldanha Bay air quality monitoring stations
Dust fallout results
The monthly average dust fallout measured in the reporting period is well below the national standard
of 1 200 mg/m
2
/day for residential areas (Table 4-9)
Table 4-9: Monthly Dust Fallout rates in Saldanha Bay Municipality 2014 (mg/m
2
/day)
Site
Oct
Nov
Dec
Vredenburg Electricity
Department
2.6
1.75
6.07
Vredenburg reservoir
7.57
28.41
10.46
Juffroushoogte
2.48
6.39
2.04
Airport
31.46
48.57
16.91
Andrews Primary
N/A
2.33
6.12
Blue Water Bay
11.73
187.57
13.83
Curro School
4.52
14.55
24.65

STATE OF AIR QUALITY MANAGEMENT: WESTERN CAPE 2014
128
4.2.1.10. Emissions Inventory – S21 Listed Activities per Local Municipal Area
Table 4-10 presents the status of the S21 Listed Activities in the WCDM during 2014.
Table 4-10: Status of S21 Listed Activities in the WCDM during 2014
Listed Activity
Type of Industry
Status
Municipal Area
Saldanha Steel
Steel manufacturing
AEL
Saldanha Bay
Transnet Port Terminal
Iron ore storage and handling
Provisional AEL
Saldanha Bay
SFF
Crude oil storage
AEL
Saldanha Bay
Tronox
Minerals smelter
AEL
Saldanha Bay
Duferco
Galvanizing
AEL
Saldanha Bay
PPC Saldanha
Drying plant
AEL
Saldanha Bay
Oceana
Fishmeal production
Provisional AEL
Saldanha Bay
Oranjevis
Fishmeal production
Provisional AEL
Saldanha Bay
WPP
Fishmeal production
Provisional AEL
Saldanha Bay
Premier Fishing
Fishmeal production
Provisional AEL
Saldanha Bay
Afrisam
Cement manufacturing
Pending
Saldanha Bay
Sea Harvest
Fishmeal production
Pending
Saldanha Bay
Oiltanking Mogs
Crude oil storage
PAEL
Saldanha Bay
RMI
Rare Metals industry
Pending
Saldanha Bay
Frontier Separation
Rare earth separation plant
Pending
Saldanha Bay
Chevron
Storage of petroleum
products
AEL
Saldanha Bay
Chlor-Alkali Holdings
Chemicals production
Pending
Saldanha Bay
PPC Riebeeck
Cement manufacturing
AEL
Swartland
Swartland Boudienste
Wood drying
AEL
Swartland
Cape Dairy Biogas
Animal matter processing
Pending
Swartland
PPC De Hoek
Cement manufacturing
AEL
Bergrivier
Foodcorp
Fishmeal production
Provisional AEL
Bergrivier
Voorberg Correctional
facility
Incinerator
Pending
Bergrivier
Namakwa Stene
Clay brick manufacturing
AEL
Matzikama
Tronox Mineral Sands
Drying plant
Provisional AEL
Matzikama
Cape Lime
Lime production
Provisional AEL
Matzikama
4.2.1.11. Air Vehicle Emission Testing
No vehicle testing done during the reporting period of 2014.
4.2.1.12. Section 21 Listed Activities – Atmospheric Emission Licensing
Table 4-11 provides a list of AEL applications and renewals (Table 4-12) received and / or processed
during the reporting period of 2014
Table 4-11: List of AEL applications received and processed in the WCDM
Applicant
Applicant Date
Date Issued
Status
Premier Fishing SA (Pty)
Ltd, Saldanha
Amended application
12/02/2014.
10/04/2014
PAEL issued
Oiltanking Mogs Saldanha
(RF) (Pty) Ltd
09/05/2012
11/11/2014
PAEL issued
Chevron SA (Pty) Ltd Sea
Harvest Site, Saldanha
28/03/2013
12/12/2014
AEL issued
Cape Lime – Vredendal
02/05/2013
19/05/2014
PAEL issued
Chlor-Alkali Holdings (Pty)
Ltd
23/09/2014
Pending
Await further
information
Cape Dairy Biogas
07/05/2014
Pending
Await further
information

STATE OF AIR QUALITY MANAGEMENT: WESTERN CAPE 2014
129
Table 4-12: List of AEL renewal applications received and/or processed during the 2014
reporting period
Applicant
Applicant Date
Date Issued
Status
West Point Processors (Pty) Ltd
18/03/2013
08/01/2014
PAEL
Swartland Boudienste (Pty) Ltd
25/03/2013
24/01/2014
AEL
Transnet Port Terminal
20/03/2013
08/01/2014
PAEL
PPC Riebeeck
05/03/2013
25/02/2014
AEL
Namakwa Klei Stene
25/03/2013 Amended
application 14/02/2014
18/03/2014
AEL
Saldanha Steel (Pty) Ltd
19/03/2013
27/03/2014
AEL
PPC De Hoek
04/03/2013
05/03/2014
AEL
PPC Saldanha
12/03/2013
18/03/2014
AEL
Duferco Steel Processing (Pty)
Ltd
20/03/2013
25/02/2014
AEL
Tronox Mineral Sands (Pty) Ltd
Smelter, Saldanha
27/03/2013
18/03/2014
AEL
4.2.1.13. Inter-Governmental Task Team
The IGTT activities conducted during 2014 related to resolving air quality matters relating to dust
management in the Saldanha Bay area.
4.2.1.14. Challenges
Animal matter processing whereby fish and fish offcuts are processed to fishmeal give rise to
offensive odours that result in public complaints. These industries are regulated through licence
conditions and are required to apply best practices to control odorous emissions. The majority
of complaints received during the reporting period are odour related.
The storage and handling of iron ore via the Saldanha Port contributes to staining of private
and public property. The Provisional Atmospheric Emission Licence will be reviewed during 2015
to determine compliance with licence conditions.
4.2.1.15. Recommendations and way forward
In order to establish a good working relationship between the West Coast District Municipality and
Local Municipalities, the following will receive special attention during 2015:
Finalisation of the MoU to address the division of air quality functions, roles and responsibilities
of District and Local Municipalities;
Establishment of a Joint Municipal Air Quality Working Group to coordinate service delivery in
respect of air quality management.
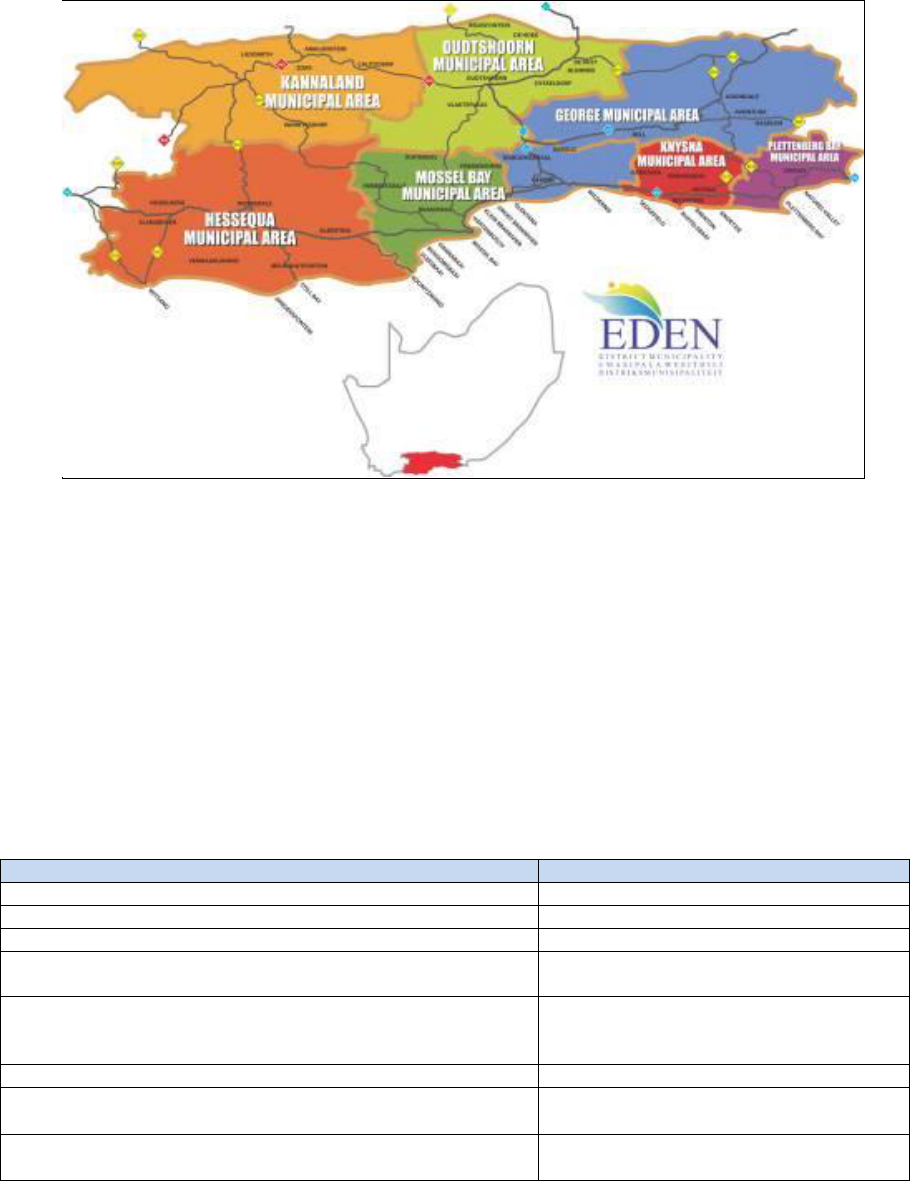
STATE OF AIR QUALITY MANAGEMENT: WESTERN CAPE 2014
130
4.2.2. EDEN DISTRICT MUNICIPALITY (EDM)
The Eden District Municipality (EDM) is the licensing authority for listed activities in the Eden region, in
terms of the National: Environmental: Air Quality Act, (Act No 39 of 2004); (NEM: AQA). Notwithstanding
limitations, EDM has succeeded in substantially meeting the diverse tasks and duties associated with air
quality management and as defined in the EDM AQMP that was approved during 2014. Figure 4-4
presents a map showing the Local Municipalities in the EDM.
Figure 4-4: Map showing location of the Eden District Municipal region
4.2.2.1. Air Quality Management Planning
The EDM AQMP was reviewed and revised and the 2
nd
Generation AQMP has been completed,
approved and included in the EDM IDP as a Sector plan. The project entailed assistance to the seven
(7) B-authorities within EDM region, whereby the EDM ensured that all seven (7) B-authorities have
AQMP`s and are in compliance with the NEM: AQA.
The various objectives detailed in Table 4-13 aims to establish an effective air quality management
activity in the EDM region. The members of the EDM AQMP Steering Committee are represented in
Figure 4-5.
Table 4-13: Air Quality Management Plan objectives for the EDM
Objective
Status of Implementation
Objective 1: Set Air Quality Goals
Completed and revised annually
Objective 2: Set Up Air Quality Management System
Completed
Task 2.1 Develop / compile emissions database
On-going
Task 2.2 Develop air quality monitoring network
On-going and liaison with other
authorities.
Task 2.3 Dispersion modelling
Completed Airshed dispersion
modelling as part of AQMP
development.
Task 2.4 Reporting
On-going
Objective 3: Carry Out Risk Assessments
Part of D: EA&DP Human Health Risk
Assessment Steering committee
Task 3.1 Health risk assessment
Part of D: EA&DP Human Health Risk
Assessment Steering Committee
STATE OF AIR QUALITY MANAGEMENT: WESTERN CAPE 2014
131
Task 3.2 Ecological risk assessment
Not initiated
Task 3.3 Exposure assessment
Not initiated
Objective 4: Assess and Select Control Measures
Work in progress
Objective 5: Implement of Intervention and Monitoring
Effectiveness
Ongoing assessment
Objective 6: Revise Air Quality Goals
Annually internal and external
stakeholders
Objective 7: Integrate the AQMP into the IDP
Completed
Objective 8: Compliance Monitoring, Enforcement and
Control
Ongoing, work in progress
Task 8.1 Licensing of listed activities, periodic review of
atmospheric emission licences, specifying continuous
industrial emission and ambient monitoring activities
Ongoing, work in progress
Task 8.2 Audit inspection plans and complaints’
investigation
Work in progress
Task 8.3 Inspection of diesel exhaust emissions
Completed and on-going
Task 8.4 Administrative enforcement
Work in progress. Eden Air Quality by-
law and spot fine system.
Task 8.5 Specification, monitoring and review of
pollution reduction plans
Work in progress.
Objective 9: Review the Air Quality Management Plan
Every 5 years.
Figure 4-5: Members of the EDM Air Quality Management Plan Steering Committee
4.2.2.2. Eden Air Quality Officer’s Forum/Industry Working Group
The EDM established an Industrial Forum Working Group in 2010. Since its establishment, the forum is
held quarterly between the industry and the EDM. The B-Municipalities in the Eden region are also
actively involved in this forum, which serves as a platform for industry to report on their air quality
interventions. The forum is also seen as a platform to provide feedback to industry regarding any air
quality matters on Provincial, Municipal and National level. During 2014, the Working Group meetings
were conducted on:
20 February 2014;
15 May 2014;
21 August 2014;
18 November 2014.
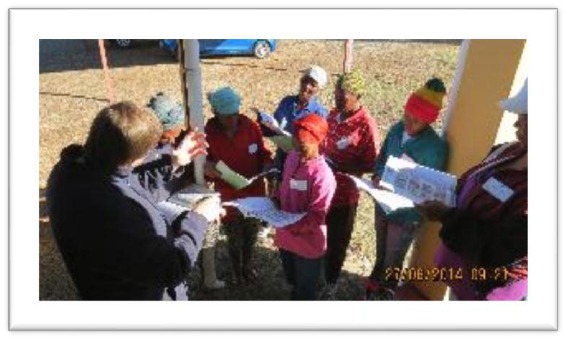
STATE OF AIR QUALITY MANAGEMENT: WESTERN CAPE 2014
132
Industries are requested to provide a quarterly report to the EDM, reporting on various air quality
activities at the specific industry. Matters relating to complaints received for the period, air quality
improvements, changes in organisational structure, etc. are reported and discussed at the forum.
Applicable presentations are also presented by guest speakers at the forum meetings, as required.
4.2.2.3. Awareness Raising
The EDM: District Air Quality Unit embarked on an air quality project, namely the Eden Clean Fire
Campaign. The project was identified due to poor air quality caused by fires used for household
purposes such as cooking and heating, particularly in the informal settlements.
The Peer Educational Project was partially funded by the EDM’s Green Municipality Competition (GMC)
prize money awarded in 2013, by the Western Cape Government, as well as EDM. The project entailed
the selection of peer educators by the Oudtshoorn Municipality: Environmental Services. Ten Peer
educators were recruited through a selection process. SA Teacher was the appointed service provider
to educate peer educators on air pollution, the health effects thereof and how the communities that
are largely dependent on fires for household purposes, can reduce the effects of fires on the
environment and their health. At the end of the course, the peer educators were each given a
certificate of attendance and a backpack that is fully equipped with all the necessary hardware and
educational materials to undertake physical demonstrations to members in their communities. Each
peer educator is required to educate at least 50 people within a two month period. Figure 4-6 shows air
quality education and awareness raising in action in the EDM.
Figure 4-6: Air quality education and awareness raising in the EDM
4.2.2.4. EDM Air Quality By-Laws
The EDM published the Eden Air Quality By-law during December 2012. The By-laws is district
municipality-specific and is based on the air quality functions of district municipalities. The EDM also set
offences and penalties during 2013 in terms of the Eden Air Quality By-law and issued several spot fines
during 2014 to those industries that contravened the By-law. The offences varied from offensive odours
to contraventions of Atmospheric Emission Licence conditions.
4.2.2.5. Emission Inventory
Bitou Municipality
The sources of air pollution identified in the Bitou Municipal region and their estimated emissions are
given in Table 4-14.
STATE OF AIR QUALITY MANAGEMENT: WESTERN CAPE 2014
133
Table 4-14: Industrial Emission Sources in Bitou
Source Emissions
TPM
SO
2
NOx
CO
CO
2
Kurlandbrik
81.5
9.5
4.0
6.3
2372.7
Vantell Bricks
140.5
16.4
7.0
10.9
4090.9
Koffieklip Houtprodukte
3.2
0.2
3.9
4.8
1567.8
TOTAL, tons per annum
225.2
26.1
15.0
22.0
8031.4
Knysna Municipality
The sources of air emissions identified in Knysna and their estimated emissions are given in Table 4-15.
Table 4-15: Industrial Emission Sources in Knysna
Source Emissions
TPM
SO
2
NOx
CO
CO
2
Willcross Timbers
1.3
0.1
1.6
2.0
635.6
Geelhoutvlei Timbers
27.2
1.7
33.3
40.7
13241.6
Fechters Sawmill (*)
0.7
0.0
0.1
14.3
1615.3
Sayn Investments
0.3
0.0
0.3
0.4
132.4
TOTAL, tons per annum
29.5
1.8
35.3
57.4
15624.9
(*) Actual measured values
George Municipality
The sources of air emissions identified in George and their estimated emissions are given in Table 4-16
Table 4-16: Industrial Emission Sources in George
Source Emissions
TPM
SO
2
NOx
CO
CO
2
Lancewood Holdings
17.0
14.7
2.8
1.3
1474.2
Outeniqua Bakery
0.02
0.08
0.24
0.06
0.3
Woodfirst
27.2
1.7
33.3
40.7
13241.6
Houttek
1.8
0.1
2.2
2.7
882.8
Cape Pine (MTO) (*)
1671.8
0.0
117.4
1346.3
9515.2
PG Bison Thesen Mill (*)
56.0
0.0
20.9
277.5
31280.0
Optimum Waste (*)
9.9
0.1
1.4
0.5
Much Asphalt (*)
3.2
317.2
SC Galvanising (*)
0.2
TOTAL, tons per annum
1787.1
333.9
178.3
1669.1
56394.1
(*) Actual measured values
Mossel Bay Municipality
The sources of air emissions identified in Mossel Bay and their estimated emissions are given in Table
4-17.
Table 4-17: Industrial Emission Sources in Mossel Bay
Source Emissions
PM
SO
2
NOx
CO
CO
2
Nestlé
408.4
352.7
68.1
30.9
35437.9
Point Caravan Park (boilers)
196.6
177.0
35.4
15.1
18333.9
Afro Fishing
0.49
6.2
2.18
0.20
1017.7
Mossel Bay Hospital Boiler 3T
0.02
0.2
0.07
0.01
33.9
Suid-Kaap Meelprodukte
0.07
0.9
0.33
0.03
154.2
Mossel Bay Panelbeaters
0.00
0.0
0.01
0.00
3.4
STATE OF AIR QUALITY MANAGEMENT: WESTERN CAPE 2014
134
Reins Tanning
0.10
1.2
0.44
0.04
203.5
Rheebok Stene
730.4
85.1
36.2
56.7
21272.7
Woodline
7.9
2.2
5.5
141.0
2629.0
South Cape Fishmeal
0.49
6.2
2.18
0.20
1017.7
PetroSA
109.0
0.5
2771.0
1210.0
834639.1
Gourikwa Power Station
1258.2
442.2
21.7
438841.0
TOTAL, tons per annum
1453.5
1890.4
3363.6
1475.9
1353584.0
Hessequa Municipality
The sources of air emissions identified in the Hessequa region and their estimated emissions are given in
Table 4-18.
Table 4-18: Industrial Emission Sources in Hessequa
Sources Emissions
PM
SO
2
NOx
CO
CO
2
Organic Aloe steam boiler
0.3
0.3
0.1
0.0
28.4
Sentraal Suid Ko-operasie
0.05
0.17
0.48
0.12
510.8
Outeniqua Pale Boiler
0.7
0.0
0.9
1.1
353.1
Riversdale Sawmill
22.6
239.9
15.1
608.3
Spitskop Stene
80.3
9.4
4.0
6.2
2340.0
Combo Timbers, Albertinia
15.8
168.1
10.6
426.3
TOTAL, tons per annum
119.8
417.9
31.2
1042.0
3232.3
Kannaland Municipality
The sources of air emissions identified in the Kannaland region and their estimated emissions are given
in Table 4-19.
Table 4-19: Industrial Emission Sources in Kannaland
Source Emissions
PM
SO
2
NOx
CO
CO
2
Parmalat
114.3
98.8
19.1
8.7
9922.6
Ladismith Kaas
98.0
84.6
16.3
7.4
8505.1
TOTAL, tons per annum
212.3
183.4
35.4
16.1
18427.7
Oudtshoorn Municipality
The sources of air emissions identified in the Oudtshoorn region and their estimated emissions are given
in Table 4-20.
Table 4-20: Industrial Emission Sources in Oudtshoorn
Source Emissions
PM
SO
2
NOx
CO
CO
2
World Class Connection
9.8
8.5
1.6
0.7
850.5
Suid-Kaap Wingerde
42.5
36.7
7.1
3.2
3685.5
Klein Karoo International
1.22
15.4
5.39
0.49
2517.8
Dysselsdorp Liquorice
0.07
0.9
0.33
0.03
152.7
Parmalat
0.07
0.9
0.33
0.03
154.2
Super Dry-Cleanette
0.00
0.00
0.00
0.00
2.8
African Sky Hotels
0.01
0.03
0.08
0.02
85.1
Cango Winery
0.01
0.02
0.05
0.01
56.8
Klein Karoo Dairy
0.01
0.02
0.06
0.02
68.1
STATE OF AIR QUALITY MANAGEMENT: WESTERN CAPE 2014
135
Johnsons Bricks
204.5
23.8
10.1
15.9
5956.4
PSP Timbers
0.5
0.0
0.7
0.8
264.8
Cango Bricks
85.2
9.9
4.2
6.6
2481.7
TOTAL, tons per annum
343.9
96.2
29.9
27.8
16276.4
4.2.2.6. Energy Sources Used in EDM
Statistics South Africa (StatsSA) gathered information about the energy used for heating, cooking and
lighting in households across the country and provided the following numbers of households and types
of fuel used in EDM. Table 4-21presents the number of households per fuel type used in the EDM.
Table 4-21: Number of household per fuel type used
Cooking
Electricity
Gas
Paraffin
Wood
Coal
Bitou
14064
1600
509
358
9
Knysna
17159
2222
1784
588
17
George
44879
3772
2725
1846
34
Mossel Bay
24061
2119
1304
304
25
Hessequa
13369
1595
29
767
11
Kannaland
5022
336
10
799
7
Oudtshoorn
17036
1706
675
2329
34
Heating
Bitou
7873
702
1702
1494
35
Knysna
13005
1023
1794
2267
78
George
30452
1938
5576
5057
53
Mossel Bay
15736
1185
2478
753
33
Hessequa
10544
451
95
1703
5
Kannaland
4037
105
19
1393
14
Oudtshoorn
13491
376
509
3788
132
Lighting
Bitou
15653
38
260
Knysna
19440
56
1255
George
48737
119
2053
Mossel Bay
26292
91
522
Hessequa
15063
41
29
Kannaland
5571
22
5
Oudtshoorn
18679
27
176
4.2.2.7. Vehicle Emission Testing
Most towns in the Eden region have the potential for excessive vehicle emissions due to the N2 highway
running through the region. This is especially the case during the December/January holiday season
when an increase in vehicles using the N2 is witnessed.
The EDM Air Quality unit embarked on a project in collaboration with the B-Municipalities Air Quality
and Traffic Department during 2014 whereby several diesel vehicles were tested for excessive smoke
emissions. The vehicles went through a visual test, followed by further testing if the visual test indicated
excessive smoke. In such cases the vehicle is tested by means of the vehicle smoke test instrument.
Verbal warnings were issued to vehicles that did not pass the smoke tests. In future, fines will be issued
by the Traffic Department. It was also clear that the bigger mainliners were usually well maintained and
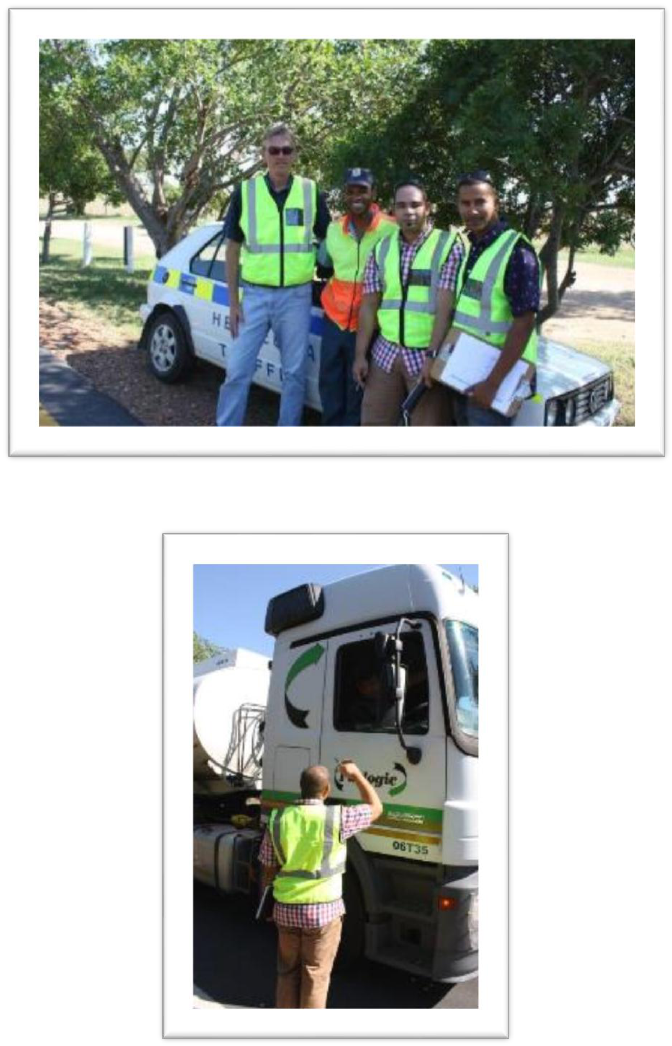
STATE OF AIR QUALITY MANAGEMENT: WESTERN CAPE 2014
136
that it was the smaller trucks and older bakkies that were problematic. This project was received
positively by the drivers of the vehicles and served as a platform for similar future projects. One of the
main objectives of this project was to make the public aware of vehicle emission testing in the Eden
region and to minimize the effect of vehicle emissions on the environment.
Figure 4-7 and Figure 4-8 shows the EDM staff members performing their duties during the vehicle
emissions inspections undertaken during 2014.
Figure 4-7: EDM staff members conducting vehicle emission testing in Riversdale
Figure 4-8: The process of emission testing was explained to the driver of a diesel truck

STATE OF AIR QUALITY MANAGEMENT: WESTERN CAPE 2014
138
Table 4-22: List of Listed Activities – Atmospheric Emissions Licensing
Applicant
Date of PAEL/AEL Application
Application
Adequately
Completed
Date of Licenses Issued
Activity
Description
New
Renewal
Review
Transfer
Variation
Yes
No
PAEL
AEL
Review
Date
Expiry Date
Fechters Sawmill
(Closed)
2012/07/27
_
_
_
_
X
_
_
2013/05/17
pending
2016/05/16
wood drying
Geelhoutvlei timbers
2010/04/16
_
_
_
_
X
_
_
2012/04/01
pending
2016/03/31
wood drying
George Krematorium
_
2013/03/27
_
_
_
X
_
_
2013/12/01
2014/10/31
2018/11/30
crematorium
Gourikwa ESKOM Power
station
_
2012/11/13
_
_
_
X
_
_
2013/05/01
2014/02/01
2018/04/30
liquid fuel
combustion
Houttek
_
2013/03/27
_
_
_
X
_
_
2014/03/12
2015/01/31
2019/02/28
wood drying
Johnsons Bricks
_
2013/03/22
_
_
_
X
_
_
2013/11/11
2014/09/30
2018/11/10
clamp kilns
KKI Abattoir
_
2013/03/08
_
_
_
X
_
_
2013/12/02
pending
2018/10/31
animal matter
KKI Tannery
_
2011/12/07
_
_
_
X
2012/10/31
2014/02/14
pending
2014/11/02
animal matter
Koffieklip houtwerke
_
2013/09/26
_
_
_
X
_
_
2014/03/01
pending
2019/02/28
wood drying
Kurland Bricks
2011/05/17
2013/02/14
_
_
_
X
_
_
2013/08/01
pending
2018/07/31
clamp kilns
MTO
2013/02/14
_
12/19/2014
_
_
X
_
_
2012/11/15
pending
2016/10/31
wood drying
Much Asphalt
_
2013/02/14
_
_
_
X
_
_
2013/12/01
pending
2018/11/30
macadam
process
Optimum Waste
_
2013/01/24
_
_
_
X
_
_
2014/03/31
2015/03/31
2019/03/31
waste
incineration
P.G. Bison
2012/01/11
_
_
_
_
X
_
_
2013/03/01
2014/05/31
2018/06/30
creosote
PetroSA Refinery
_
2012/01/16
_
_
_
X
_
2013/04/01
2014/04/01
2014/02/01
2014/03/31
petroleum
industry
PetroSA Tank Farm
_
2013/03/27
_
_
_
X
_
_
2013/12/12
2014/09/30
2018/12/11
petroleum
industry

STATE OF AIR QUALITY MANAGEMENT: WESTERN CAPE 2014
139
PSP Timbers
2013/08/28
_
_
_
_
X
_
2015/01/05
_
_
_
tar and wood
drying
Rheebok Stene VSBK
_
_
_
_
7/1/2014
X
_
7/1/2014
_
pending
2015/06/30
VSBK
Rheebok Stene
_
2013/02/14
_
_
_
X
_
_
2013/08/01
pending
2018/07/31
clamp kilns
Riversdal Saagmeule
_
2013/03/14
_
_
_
X
_
_
2013/11/09
2014/11/30
2014/12/08
wood drying
Scot
2011/05/15
_
_
_
_
X
_
_
2012/12/10
pending
2016/12/09
animal matter
Shell
2012/10/11
_
_
_
_
X
_
_
2013/11/01
pending
2017/10/30
storage of
petroleum
South Cape fishmeal
2011/12/15
_
_
_
_
X
_
2014/03/01
pending
2014/02/28
animal matter
South Cape
Galvanizing
2011/08/05
_
_
_
_
X
_
_
2013/05/15
pending
2017/05/14
galvanizing
South Cape Poles
2010/07/19
_
_
_
_
X
_
2012/08/14
2013/08/14
_
_
creosote
Spitskop Stene
_
2013/03/26
_
_
_
X
_
_
2014/02/01
pending
2018/01/31
clamp kilns
Thesen Sawmill
_
2011/10/21
_
_
_
X
_
_
2013/07/01
2014/05/31
2018/06/30
wood drying
Vantell Bricks
_
2013/03/25
_
_
_
X
_
_
2013/11/12
pending
2018/11/11
clamp kilns
Techno asphalt
2013/04/02
_
_
_
_
_
_
2014/06/04
_
4/1/2015
6/3/2015
macadam
process
STATE OF AIR QUALITY MANAGEMENT: WESTERN CAPE 2014
140
4.2.2.9. Air Quality-related Complaints
The EDM is actively involved in handling complaints and assisting B-Municipalities in this regard. All
complaints are captured on our electronic database and dealt with within certain time frames. The
EDM chairs various Inter Governmental Task Team (IGTT) activities to address complex complaints in a
co-operative manner (Table 4-23).
Table 4-23: Number of air quality-related complaints received in the EDM
Eden 2014 Complaints
2014 Complaints
Category
1 January 2014 -
31 March 2014
1 April 2014 -
30 June 2014
1 July 2014 -
30 Sept 2014
1 October 2014 -
31 December 2014
Total
Fumes
0
0
0
0
0
Smoke
4
2
4
2
12
Dust
2
1
1
1
5
Burning waste/Tyres
0
0
1
0
1
Farm land burning
0
0
0
0
0
Crop spraying
0
0
0
0
0
Offensive odours
2
16
4
3
25
Unlicensed Facilities
0
0
0
0
0
Noise
0
0
0
0
0
Other
0
0
0
0
0
Total
8
19
10
6
43
Odour
Most of the air quality complaints received for 2014 were odour related, of which 80% were due to
animal matter processes and the remainder due to odours from fumes from creosote plants, etc. The
Animal matter processes is high priority for the Eden district and significant effort has been put in to
mitigate the odour. Some interventions included the appointment of odour specialists and chemical
engineers to assess and provide solutions to mitigate the odour. The installation of abatement
equipment was enforced through the licensing process in order to mitigate the offensive odours;
significant successes have been made in this regard.
Inter-Governmental Task Team – Oudtshoorn
When certain complaints are complex or persistent, the EDM addresses such complaints by forming
and chairing an Intergovernmental Task Team (IGTT). The IGTT is a method where various
interdepartmental authorities address the complaints in a coordinated manner. IGTT`s were successfully
utilized in Oudtshoorn and George. During 2014, an IGTT resolved an odour-related complaint in
George, proving that air quality management success depends on co-operative governance
approaches being applied.
4.2.2.10. Co-operative Governance
The Hessequa Municipality urgently needed to implement an air quality control function within its
jurisdiction and entered into a Service Level Agreement with the EDM to render the service to the
Hessequa Municipality.
In terms of this agreement the EDM is responsible for:
(a) co-ordinating the development of the Hessequa Air Quality Management Plan for inclusion
in the Integrated Development Plan of the Council, in accordance with chapter 5 of the
Municipal Systems Act;
(b) preparing an annual report to the Council on air quality; and
STATE OF AIR QUALITY MANAGEMENT: WESTERN CAPE 2014
141
(c) exercing the duties and powers assigned to him or her under the By-law under the
direction of the Executive Manager: Community Services and the Manager Municipal
Health and Environmental Services, related to industrial activities and excludes minor air
quality issues like open burning at residential areas, which would still be dealt with by the
Hessequa Municipality Law Enforcement Section.
Various routine inspections were conducted during the reporting period. The main purpose of the
inspections was to measure compliance with the Hessequa Air Quality By-laws. This did not include the
site visits in terms of AEL`s or for the permitting of small boiler permitting. Inspections entailed the
identification of a potential air quality problem, the evaluation of the situation and the
implementation of control measures to improve the situation.
Very little air quality complaints were received during the reporting period. Most of the complaints were
related to dust, smoke and odour. The complaints were investigated and notices served to the industry
causing the complaint. Most of the complaints were solved or the situation improved.
4.2.2.11. Air Quality Training
Eden provided training to the Peer Educators in terms of the Eden Clean Fires campaign. Furthermore
pamphlets were distributed to the general public on Air pollution awareness.
Eden Air Quality unit also conducted Air quality Training to the Cape Peninsula University of Technology
nursing students during 2014.
Eden staff attended various internal and external training sessions such as:
Environmental Impact assessment
Training session on the new NEMA Environmental Impact Assessment Regulations and Listing
Notices.
Minimum Competency training on Municipal Financial Management.
4.2.2.12. Eden Air Quality Officers Forum
EDM has established an Air Quality Forum with air quality officers of the B-Municipalities. This is to
improve communication between Authorities and also to disseminate information. Air quality hot spots
are discussed with possible solutions. This also creates a platform for implementing the provincial Air
quality Management plan. B-Municipalities are regularly visited to keep contact with Air quality officers
and assisting with complaints dealing.
4.2.2.13. Air Quality Monitoring / Passive sampling
EDM is conducting passive air quality monitoring for SO
2
, NO
2
, H
2
S and BTEX in various towns within the
Eden region. The towns involved are selected due the potential air quality impacts that are eminent.
Albertinia, Riversdale, Mossel Bay, Oudtshoorn and Great Brak River are towns in Eden where passive
sampling is undertaken. Passive sampling was also utilised to assess air quality complaints (Table 4-24).
Table 4-24: EDM passive sampling for SO
2
, NO
2
, H
2
S and BTEX
Town
Pollutant
Exceedances for 2014
Albertinia
SO
2
/ NO
2
, BTEX
0
Mossel Bay
SO
2
/ NO
2
0
Great Brak river
SO
2
/ NO
2
0
Riversdale
SO
2
/ NO
2
0
The EDM’s passive sampling project and results are represented in Figure 4-9 to Figure 4-11.
STATE OF AIR QUALITY MANAGEMENT: WESTERN CAPE 2014
142
Figure 4-9: EDM passive sampling project at Mossel Bay and Albertinia
Figure 4-10: Passive sampling results for H
2
S for June 2014
Kleinberg Saagmeule Cape Honeybush Tea
H2S
0.02 0.01
Odour detection
7 7
0.02
0.01
7 7
0
1
2
3
4
5
6
7
8
Concentration (ppb)
H
2
S Passive Sampling
Kleinberg Saagmeule / Cape Honey Bush Tea
June 2014
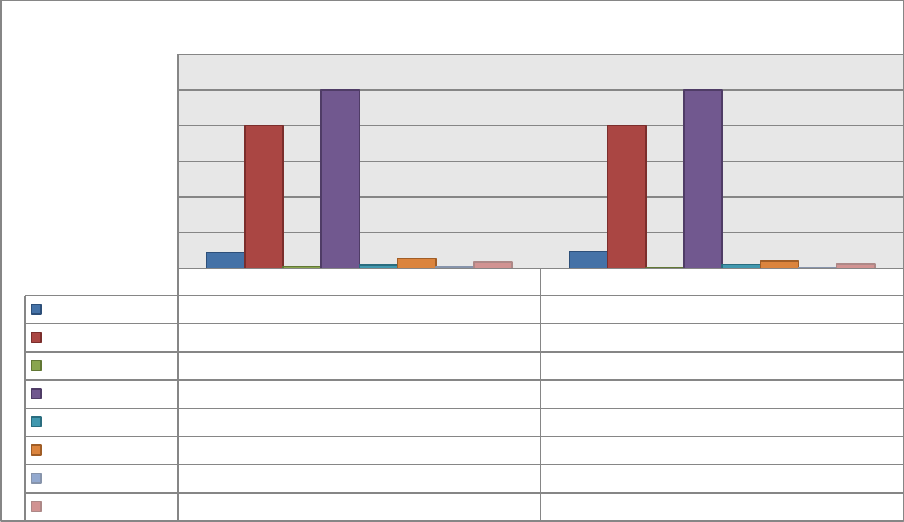
STATE OF AIR QUALITY MANAGEMENT: WESTERN CAPE 2014
143
Figure 4-11: Passive sampling results for SO
2
, NO
2
and BTEX in Riversdale
4.2.2.14. Summary
Air quality management is a complex matter. Notwithstanding these limitations, the EDM has
succeeded in substantially meeting the diverse tasks and duties associated with air quality
management in the Eden region. Good co-operation exist between the EDM and the local B-
Municipalities. The EDM is looking forward to continuous support in order to promote and maintain a
healthy and pollution free environment in the Eden district.
Ixia Street Riverdal Fynbos Park Riverdal
Concentr NO2
4.45 4.68
Standard NO2
40 40
Concentr SO2
0.56 0.12
Standard SO2
50 50
Benzene
0.89 1.05
Toluene
2.66 2.01
Ethyl Benzene
0.43 0.27
Xylene
1.82 1.19
4.45
4.68
40 40
0.56
0.12
50 50
0.89
1.05
2.66
2.01
0.43
0.27
1.82
1.19
0
10
20
30
40
50
60
Concentration (µg/m³)
NO
2
, SO
2
and BTEX Passive Sampling in Riversdale
August 2014
STATE OF AIR QUALITY MANAGEMENT: WESTERN CAPE 2014
144
4.2.3. CAPE WINELANDS DISTRICT MUNICIPALITY (CWDM)
The following provides an account of the progress made by the Cape Winelands District Municipality
(CWDM) with regards to implementing its legislative functions of the NEM: AQA during 2014.The CWDM
developed an AQMP for their jurisdictional area, which was approved and adopted by Council in
2010. This AQMP was incorporated into the CWDM Integrated Development Plan (IDP) since 2011,
thereby committing the CWDM to fulfil its statutory obligations in terms of the NEM: AQA.
In order to give effect to the right contained in Section 24 of the Constitution and the NEM: AQA, the
CWDM Mayoral Committee meeting dated 08 September 2006 resolved that the Municipal Manager
must designate an Air Quality Officer (AQO). The responsibility and accountability for the
implementation of the NEM: AQA is the responsibility of the CWDMs Directorate: Community and
Development Services, with the designated AQO within the Department Municipal Health Services
(MHS).
4.2.3.1. Air Quality Management Planning
The CWDM had the AQMP approved by Council in 2010 and reflect in the annual CWDM IDP. The
CWDM responsibility and accountability for the implementation of the NEM: AQA the Directorate:
Community and Development Services, with the designated AQO within the Department Municipal
Health Services (MHS).
The CWDM Air Quality Management Plan (AQMP) must be reviewed in 2015 after its 5 year cycle, as
required by the NEM: AQA. The D: EA&DP will be reviewing the Western Cape AQMP during 2015/2016
financial year; the CWDM AQMP will dovetail into the Western Cape AQMP and the framework
fundamentals of the Western Cape AQMP must be used as a guideline. The CWDM AQMP review will
commence after the review of the WC AQMP during the 2015-2016 financial year.
4.2.3.2. Education and Awareness-raising
The CWDM MHS raises awareness through its Environmental Health Education programme, which
includes live theatre performances at schools, the development of placards, pamphlets, posters and
other educational material and information on air pollution control. The live theatre reached 37 700
learners at 80 schools. In addition, educations at schools, farms and to first home-owners were given.
Taken up within this education is healthy living, safe environmental practices, the sustainable use of
resources, etc., which address indoor and outdoor pollution.
The CWDM MHS Clean-up Campaign 2014 had 30 projects using local small-scale contractors to
undertake waste clean-up projects in residential areas throughout the Cape Winelands region. The aim
of the project was to create awareness with respect to the environment to the general public.
Contractors were educated on pollution control, which included air pollution control.
4.2.3.3. Air Quality Monitoring
Ambient air quality monitoring is undertaken by the D: EA&DP monitoring stations located in
Stellenbosch and Worcester. In order to conduct data communications and transfer of data from the
air quality monitoring stations, the monitoring data are verified and assessed by the D: EA&DP. The
CWDM receives data from D: EA&DP to determine the state of ambient air quality within the area
where these stations are placed.
The following activities were undertaken by the CWDM to assist the D: EA&DP with the monitoring
stations located in the Cape Winelands region:
• CWDM officials assist D: EA&DP if and when required in monitoring activities;
• CWDM officials assist when required to perform tasks at D: EA&DP monitoring stations;
• Set conditions within AEL’s to listed activities to monitor in accordance with the NEM: AQA;
• Give input and guidance to industry on monitoring requirements in terms of the NEM: AQA.
4.2.3.4. Air Quality Management Training
The AQO attended DEA’s EIA accredited training on 3 – 7 February 2014 and DEA NAEIS training on the
11-12 June 2014.
STATE OF AIR QUALITY MANAGEMENT: WESTERN CAPE 2014
145
4.2.3.5. Air Quality By-laws or legislation
CWDM has not promulgated their AQ By-law.
4.2.3.6. Air Quality Forum/Industry Working Groups
The CWDM has a designated AQO to perform functions as required by the NEM: AQA. In addition, the
CWDM has included the functions of air quality in the job descriptions of all Environmental Health
Practitioners.
The CWDM has established an Industrial Air Quality Forum to inform members of legislation
amendments or new legislation, as well as set conditions within AEL’s, whereby some license holders are
requested to establish environmental forums and report on environmental performance.
The WCDM AQO attended AEL Forum meetings hosted by NACA Western Cape Branch seminar
“Understanding Legal Requirements of an AEL” – 5 November 2014.
Activities undertaken by AQO’s at the B-Municipalities in the CWDM:
• The Drakenstein Municipality designated an AQO and approved their AQMP. They also
embarked on the compilation of a comprehensive emissions inventory for non-listed industries.
The municipality has purchased a sound level meter for noise control and the AQO is a
designated EMI.
• The Witzenberg Municipality has a designated AQO and is in the process of drafting an AQMP.
• The Stellenbosch Municipality has an official accountable for air quality related matters. An
AQO has not been designated; an AQMP has not been developed.
• The Langeberg Municipality designated an AQO but has not drafted an AQMP as yet.
• The Breede Valley Municipality has an official accountable for air quality related matters. No
AQO has been designated, and neither has an AQMP been developed.
4.2.3.7. Emissions Inventory
The emissions inventory of all Section 21 Listed Activities within the CWDM is up to date. The Drakenstein
Correctional Services is completing an EIA process to install incinerators at their abattoir that will require
an AEL. Table 4-25 shows the S21 Listed Activities in the CWDM during 2014.
Table 4-25: Summary of the S21 Listed Activities – Atmospheric Emissions Licensing in the CWDM
Listed Activity
Activity Description
IC-SA Crematorium
Crematorium
Rainbow Chicken Farms
Animal Rendering Plant
Worcester Bakstene
Clamp kilns for brick production
Naude Bakstene Bk
Clamp kilns for brick production
Klein Karro Baksteen en Vervoer Maatskappy
Clamp kilns for brick production
Cape Lime
Lime production
Twohil Co
Clamp kilns for brick production
Drakenstein Crematorium
Crematorium
Paarl Brickfields
Clamp kilns for brick production
De Hoop Brickfields
Brick production
Rheinmetall Denel Munition
Ammunition Production
McMillan Bricks
Clamp kilns for brick production
Boland Bricks
Clamp kilns for brick production
Cabrico Brickfields
Clamp kilns for brick production
Cape Sawmills
Sawmill and wood drying
Provincial Veterinary Laboratory
Veterinary Waste Incinerator
Drakenstein Municipality Premix Plant
Macadam Premix Plant *
Drakenstein Municipality WWTW Waste Incinerator
Waste Incinerator*
STATE OF AIR QUALITY MANAGEMENT: WESTERN CAPE 2014
146
*D: EA&DP is the licensing authority for two listed activities operated by the Drakenstein Municipality within the
CWDM.
A total of fourteen (14) AELs were issued by the CWDM, following the APPA-AEL transitional
arrangements by the end of September 2014. Conditions and reviews of these AEL’s are scheduled for
2015. All S21 Listed Activities in the CWDM were visited at least twice during 2014 and industry was
educated on best practical means to avoid air pollution, as required by NEM: AQA.
4.2.3.8. Air Quality-related Complaints
The CWDM reported on complaints as received by the district. It should be noted that not all
municipalities provided statistics on complaints; further not all the municipalities have an air quality
complaint reporting system.
Table 4-26: Number of air quality-related complaints received in the CWDM
CWDM 2014 Complaints
2014 Complaints
Category
1 January 2014 -
31 March 2014
1 April 2014 -
30 June 2014
1 July 2014 -
30 Sept 2014
1 October 2014 -
31 December 2014
Total
Fumes
0
0
0
1
1
Smoke
10
6
2
4
22
Dust
1
1
4
1
7
Burning waste/Tyres
2
0
2
0
4
Farm land burning
0
13
0
0
13
Crop spraying
0
0
2
4
6
Offensive odours
27
24
18
35
104
Unlicensed facilities
0
0
0
0
0
Noise
13
15
4
1
33
Other
0
2
0
0
2
Total
53
61
32
46
192
Odour
The majority of complaints were received pertain to Animal Matter Processing. As the National Ambient
Air Quality Standards does not make provision for limit values as odour indicators, aimed to reduce the
detrimental effect on the receiving environment, the CWDM therefor set conditions in the PAEL in terms
of guidelines that have been published internationally in the determination of the odour impact.
Various conditions have been included in PAEL’s to address odour-related matters at facilities.
Inter-Governmental Task Team
A meeting was held with Department of Agriculture, Forestry and Fisheries (DAFF) in November 2014
with regards to areal application program of Fruit fly bait in the CWDM. The D: EA&DP and other
municipalities attended this meeting with discussions on the application of all agrichemicals and
biomass burning in the agriculture sector.
The CWDM participated and provided inputs in relation to air quality on a variety of provincial and
National platforms:
The CWDM developed an Annual State of Air Report for the district, that was incorporated into
Western Cape State of AQM Report;
Provincial Air Quality Officers Forum held quarterly;
Western Cape Air Quality Health Risk Assessment;
Provincial Strategic Objective 7 Work Group;
Government Air Quality Lekgotla.
STATE OF AIR QUALITY MANAGEMENT: WESTERN CAPE 2014
147
4.2.3.9. Co-operative Governance
No formal Service Level Agreement has been drafted between the CWDM and the B-Municipalities;
however, the CWDM provide support to these municipalities with regards to air quality management, if
requested.
In 2014, the co-operation and co-ordination in terms of air quality management at B-Municipalities in
the CWDM improved. Although significant improvement was made, the availability of capacity within
these authorities in terms of personnel, skills, resources and tools still remains a challenge. The CWDM
assisted Stellenbosch and Langeberg Municipalities with regards to the registration of small fuel burning
appliances.
The Following were undertaken by the CWDM:
Assist all five B-Municipalities within the CWDM with their air quality complaints received and
rendering basic air quality functions. When required the CWDM set up IGTTs between D:
EA&DP, CWDM and the applicable B-Municipality.
Several noise complaints in Stellenbosch were addressed.
Handled a change of small boilers at chicken boilers from electricity to coal fired boilers
within Drakenstein, Stellenbosch and Breede Valley.
Addressed the burning of refuse at municipal dumpsite at Montague.
Addressed odour complaints with regards to Listed Activities in Breede Valley.
Several odour complaints were received by Local Municipalities from the public and were
directed to CWDM.
4.2.4. OVERBERG DISTRICT MUNICIPALITY (ODM)
The purpose of the report is to give an insight into the Air Quality Management functions and progress
made with regards to the implementation of the Air Quality Management Plan of Council.
4.2.4.1. Air Quality Management Planning
The Air Quality Management team was officially established in February 2013 and is responsible for air
pollution control in the area of jurisdiction of the Overberg District Municipality (ODM) and its main
function is to regulate S21 Listed Activities in terms of the National Environmental Management: Air
Quality Act, 2004 (Act 39 of 2004). These activities include major industries such as fishmeal production,
clay brick manufacturing and lime processes.
In terms of Section 14 and 15 of the NEM: AQA, each Municipality must:
Designate an Air Quality Officer, and
Include an Air Quality Management Plan (AQMP) in its Integrated Development Plan (IDP).
The above mentioned legal requirements have been complied with by the end of February 2013, with
the final approval of the ODM AQMP by Council.
On 8 December 2014, the Draft Air Quality Management By-law has been presented to Council and
was approved, in principle.
Once Air Quality Management By-laws have been promulgated by the District and all Local
Municipalities, the division of functions will receive priority attention through the signing of a
Memorandum of Understanding. The actual monitoring with progress made in this regard will be
undertaken via quarterly meetings with all Air Quality Officers designated by the District and Local
Municipalities.
4.2.4.2. Air Quality Officer’s Forum
The ODM Air Quality Officers Forum (AQOF) was established on 18 June 2013, with members from the
District Municipality, Local Municipality (Swellendam, Cape Agulhas, Theewaterskloof and Overstrand)
and D: EA&DP. The Terms of Reference (ToR) for the forum was also compiled and adopted by the

STATE OF AIR QUALITY MANAGEMENT: WESTERN CAPE 2014
148
forum members. The aim of the forum is to promote sustainable development through an integrated
approach in order to ensure that atmospheric emissions from industrial and other activities are in
compliance with legal standards. The Forum meeting takes place once a quarter, prior to the Western
Cape Air Quality Officer’s Forum, unless air quality matters require urgent attention. The meetings were
held on the following dates during 2014:
Thursday, 10 April 2014;
Thursday, 10 July 2014; and
Thursday 13
November 2014;
The meetings were convened at the ODM Municipal Health Offices in Hermanus, and will in the future
rotate within the Overberg District Region.
Figure 4-12 shows the members of the ODM AQMP Steering Committee.
Figure 4-12: Members of the ODM Air Quality Management Plan Steering Committee
4.2.4.3. S21 Listed Activities – Atmospheric Emission Licensing
Table 4-27 shows the S21 Listed Activities that are currently regulated in the ODM region, during 2014.
Table 4-27: Listed Activities – Atmospheric Emissions Licensing in the ODM
Listed Activity
Type of Industry
Status
Sub-District Area
P & B Lime Works
Lime products
Provisional AEL
Cape Agulhas
Bredasdorp bricks
Clay Brick manufacturing
APPA Certificate
Cape Agulhas
Beukes bricks
Clay Brick manufacturing
APPA Certificate
Theewaterskloof
Bot River Bricks
Clay Brick manufacturing
APPA Certificate
Overstrand
Gansbaai Marine
Fish meal production
APPA Certificate
Overstrand
STATE OF AIR QUALITY MANAGEMENT: WESTERN CAPE 2014
149
4.2.4.4. Air Quality Training
The commencement of environmental laws such as the NEM: AQA and the National Environmental
Management: Waste Act has placed considerable duties on local authorities to undertake
environmental compliance and enforcement functions.
The D: EA&DP hosted Environmental Management Inspector (EMI) training for municipal officials in
order for them to be designated perform out their compliance and enforcement functions in terms of
environmental legislation. It should be noted that this was the first EMI training to be hosted to local
government officials. Bulelwa Mtakati (Municipal Health) and Rulien Volschenk (Environmental
Management) attended and successfully completed a three weeks EMI training course, which took
place during 19 November 2014 - 5 December 2014. Figure 4-13 shows the recently designated EMIs,
after receiving their EMI certificated, issued in terms of Section 31C of NEMA (Act No 107 of 1998).
Figure 4-13: Bulelwa Mtakati (Municipal Health) and Rulien Volschenk (Environmental Management)
from ODM after receiving their EMI certificates
Air quality monitoring training was provided by Ms S Benson of D: EA&DP on 13 November 2014, in
conjunction with the Overberg Air Quality Officer’s Forum (Figure 4-14 to Figure 4-16).
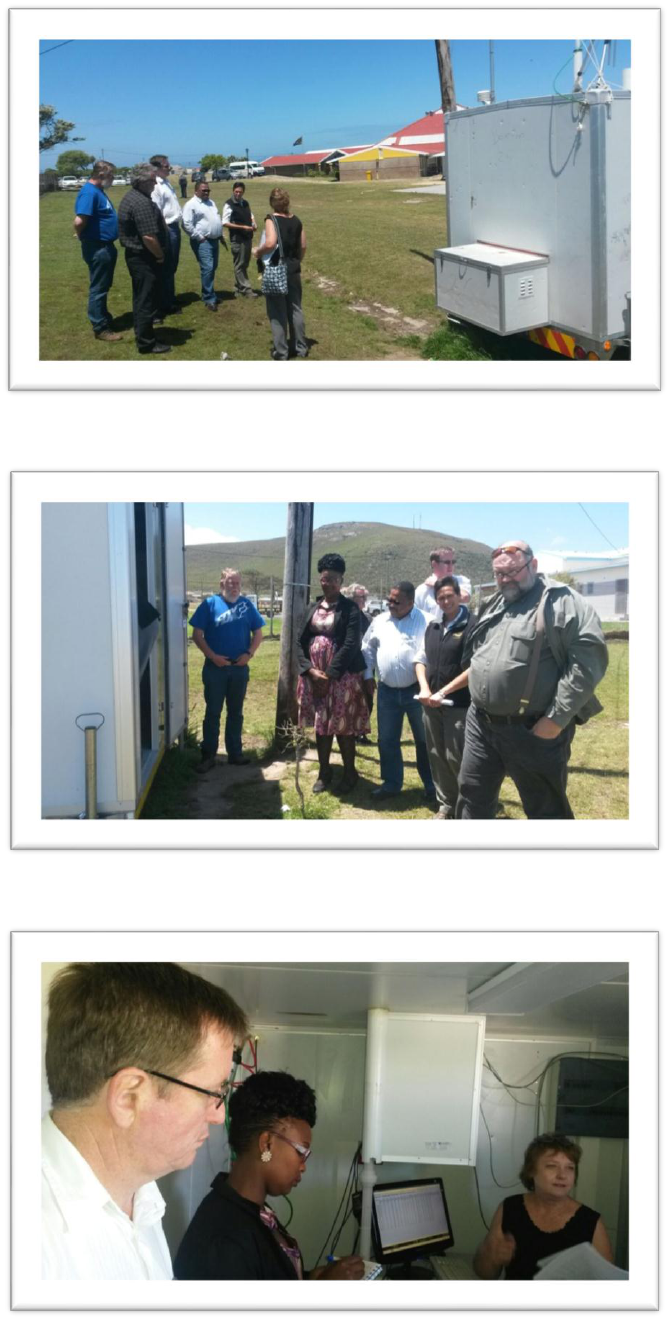
STATE OF AIR QUALITY MANAGEMENT: WESTERN CAPE 2014
150
Figure 4-14: Training session on ambient air quality monitoring in Hermanus
Figure 4-15: Training session on ambient air quality monitoring in Hermanus AQMS
Figure 4-16: Training session on ambient air quality monitoring in Hermanus AQMS
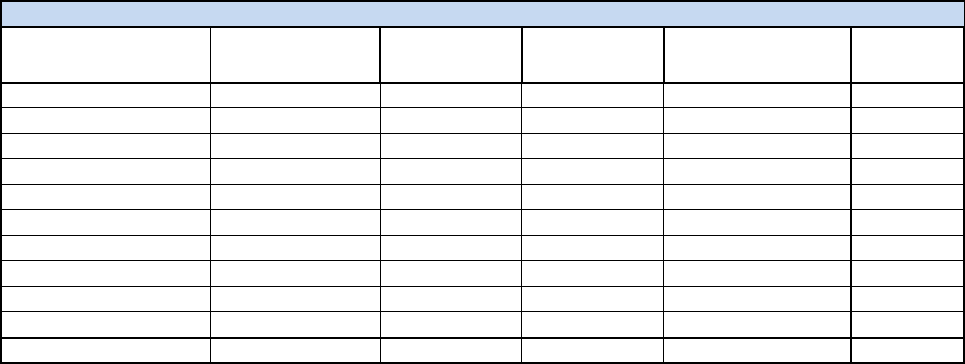
STATE OF AIR QUALITY MANAGEMENT: WESTERN CAPE 2014
151
4.2.4.5. Education and Awareness-raising
The ODM has not initiated education and awareness raising programmes on air quality during 2014;
however, plans and budget have been made available to initiate such programmes in the future.
4.2.4.6. Recommendations and way forward
The divisions of roles and responsibilities between local and district municipalities are not clearly
understood or have not been accepted by a few local municipalities. This hampers
cooperative governance and the implementation of the air quality management function. The
ODM has accepted its responsibility for the licensing of S21 Listed Activities. The enforcement of
nuisances relating to air quality is the local municipality’s responsibility.
Not all local municipalities have appointed Air Quality Officers, thereby hampering
accountability in air quality management.
Air quality management requires cooperation from various disciplines within local government,
which includes amongst others, traffic, municipal health, fire and rescue, town planning,
engineering, building control, etc. The successful implementation of air quality management is
strongly dependent upon cooperation and communication among all sectors and all local
governments within the ODM region.
There is currently inadequate financial provision earmarked for air quality management by all
municipalities within the ODM region.
The availability of suitably skilled human resources remains a challenge.
Town planning and road planning do not always consider the impact of developments on air
quality.
4.2.4.7. Air Quality-related Complaints
Table 4-28 shows the number of air quality related complaints as received by the ODM. Most
complaints relate to dust and odour, which are all addressed immediately when received by the ODM.
Table 4-28: Number of air quality-related complaints received in the ODM
ODM 2014 Complaints
2014 Complaints
Category
1 January 2014 -
31 March 2014
1 April 2014 -
30 June 2014
1 July 2014 -
30 Sept 2014
1 October 2014 -
31 December 2014
Total
Fumes
0
2
0
0
2
Smoke
1
0
0
1
2
Dust
1
1
3
1
6
Burning waste/Tyres
0
4
0
0
4
Farm land burning
0
0
0
0
0
Crop spraying
0
0
0
0
0
Offensive odours
4
0
0
5
9
Unlicensed Facilities
0
0
0
0
0
Noise
0
1
0
0
1
Other
0
0
0
0
0
Total
6
8
3
7
24
4.2.5. CENTRAL KAROO DISTRICT MUNICIPALITY (CKDM)
The purpose of the report is to give insight into the air quality management functions and progress
made with regards to the implementation of the functions of the NEM: AQA, in the Central Karoo
District Municipality (CKDM).
The air quality management function within the CKDM resorts under the Section: Environmental Health.
The District Municipality has appointed an Air Quality Officer, which in turn appointed an Environmental
Health Practitioner (EHP) to assist with implementing the functions of air quality management in the
region.
STATE OF AIR QUALITY MANAGEMENT: WESTERN CAPE 2014
152
4.2.5.1. Air Quality Management Planning
The Air Quality Management Plan (AQMP) for the CKDM was adopted by Council during 2012.
Currently, the CKDM does not have a By-law for air quality management.
The AQMP was included in the Integrated Development Plan (IDP) of the CKDM. There are no funds
allocated for this service due to financial constraints.
4.2.5.2. S21 Listed Activities – Atmospheric Emission Licensing
No AEL applications for renewals were received or new AEL’s were processed / issued during 2014.
4.2.5.3. Education and Awareness-raising
Education and awareness on air quality is undertaken through the placement of articles in the local
newspaper, “The Courier” from time to time, as well as during normal services rendered with regards to
pollution management in the CKDM region.
4.2.5.4. Air Quality Training
No formal training was given to personnel during 2014, except for personnel attending meetings where
discussions on air quality management took place.
4.2.5.5. Air Quality Monitoring / Passive sampling
No sampling actions were undertaken during 2014.
4.2.5.6. Air Quality By-laws or legislation
Currently the CKDM does not have a By-law for air quality management.
4.2.5.7. Air Quality Forum / Industry Working Groups
An AQO was designated from the ranks of the Municipal Health component of the CKDM. AQO’s have
also been appointed within the different Category B–Municipalities in the Central Karoo District.
The current capability of the CKDM is limited by the shortage of personnel and finances. Municipal
officials do not have the necessary skills to deal with the variety and complexity of modern air pollution
monitoring, modeling and control functions. As a result, a training program needs to be established in
order for officials to gain the level of expertise demanded by their functions. This will enable them to
exercise their duties with more effectiveness, resulting in an improved level of air quality management
across the CKDM.
Industry and private individuals, as well as civil society, must also be capacitated to develop the
understanding that air is an important resource. It is important that a local AQOF be established
between the CKDM and the B-Municipalities in the district.
4.2.5.8. Emissions Inventory
Pollution from industrial activities in the urban and rural areas of the CKDM is almost nonexistent, except
for a few brickworks, waste reduction “incinerators”, small boiler, vehicle emissions and burning on refuse
sites.
There are relatively few sources of air pollution in the CKDM; as a result, ambient air quality is generally
good.
4.2.5.9. Vehicle Emission Testing
No vehicle emission testing were undertaken during 2014
STATE OF AIR QUALITY MANAGEMENT: WESTERN CAPE 2014
153
4.2.5.10. Air Quality Related Complaints
Odour
No complaints were received or investigated during 2014.
Noise
No complaints were received or investigated during 2014.
Inter-Governmental Task Team
No IGTT’s were undertaken during 2014.
4.2.5.11. Co-operative Governance
No service level agreements were signed during 2014.
4.2.5.12. Recommendations and way forward:
The District and Local Municipalities within the Central Karoo District currently cannot fully accept their
responsibility with the implementation of the NEM: AQA. The current capability of the CKDM is limited
by the shortage of personnel, finances, skills and tools required for effective and coordinated air
quality management.
Industry and private individuals, as well as civil society, must also be capacitated to develop the
understanding that air is an important resource. An extremely limited level of information about the
quality of the ambient air in the CKDM region is currently available. It is therefore, not possible to make
any clear deduction about any potential risk that may exist in the district. The limited and in-house skills
for maintaining and operating monitoring equipment and networks present challenges.
Virtually all of the road traffic, especially heavy diesel-powered vehicles, between the Western Cape
and Gauteng pass through the towns of Laingsburg and Beaufort West and the average speed of the
traffic is very low, especially in the town Centre. The control and reduction of vehicle emissions is a
challenge that needs to be addressed.
The problem is further compounded by the lack of both financial and suitably skilled human resources.
Further complexities may exist between the licensing function, the EIA and Town Planning
authorization processes which need to be addressed.
4.2.6. SUMMARY
Overall, the City of Cape Town Metropolitan and the District Municipalities in the Western Cape have
taken up the air quality management function, as mandated through the NEM: AQA. Where
challenges exist in terms of fulfilling this mandate, particularly in terms of Local Municipalities, the D:
EA&DP has been and will continue to work with District Municipalities to ensure effective and efficient
air quality management in the regions. The aim is to have 31 AQOs designated in the Western Cape. To
date, 26 out of 31 AQOs have been designated, inclusive of the Provincial AQO.
Further, all Municipalities are required to have approved AQMPs, as per the NEM: AQA. To date, the
Western Cape has 14 approved AQMPs and 10 draft AQMPs, with seven AQMPs not developed. The D:
EA&DP will work closely with those Municipalities without approved AQMPs.
